TPO Profile Price Targets For S&P 500 E-Mini Futures Index
Candy Matheson | Mar 01, 2020 05:53AM ET
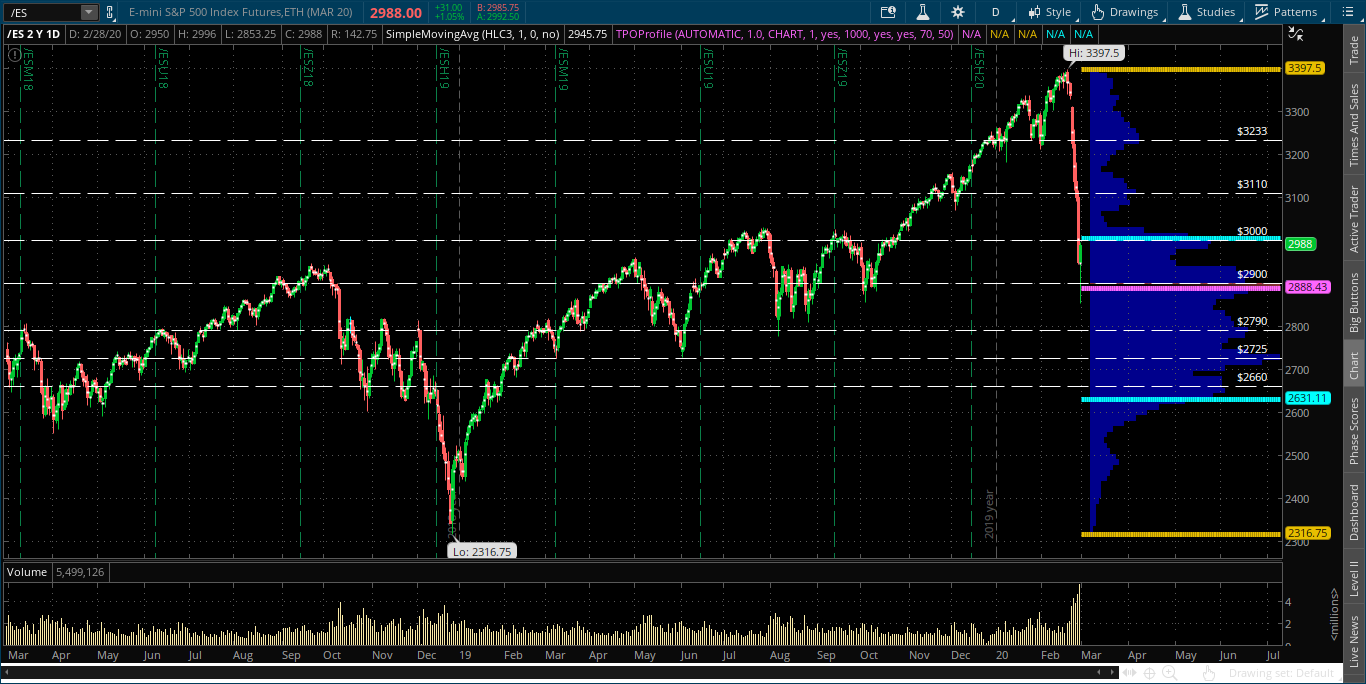
Shown on the right-hand side of the daily chart of the S&P 500 E-mini Futures Index (ES) is a TPO Profile. It represents trading activity over a period of time at specified price levels and is shown in vertical histogram format (dark blue). Its outer edges at the top and bottom are defined by the two yellow lines. The longest row of the TPO defines the price level that was hit the most during the specified time period. This level is called the POC (Point of Control) (pink line). The price range surrounding the POC where 70% of the trading activity occurred is called the Value Area (area in between the two turquoise lines).
The time period I've chosen for this post is two years for the purpose of showing, not only the POC and Value levels, but also the lesser price levels that were hit multiple times that can be used as potential target prices in the event of a further decline, or a reversal to the upside next week (broken white lines).
In Friday's action, the ES plunged down through the POC (2888) and, ultimately, spiked higher to close at 2988, just below the upper edge of the Value Area (3004).
So, those two price levels will be important resistance and support levels in the immediate term. Any sustainable activity in either direction must hold above or below those levels.
The next resistance level is around 3110, while the next support level is around 2790.
Inasmuch as this week's purge brought extremely high volumes, we may be seeing some sort of short-term capitulation, to support a further rally in the ES. However, anything is possible, including a retest of the lows of Friday's hammer before traders come to grips with all accompanying risks, and price direction sorts itself out.
So, trade with caution, as volatility is still alive and kicking!
Price has dropped below 80, as shown on the following daily ratio chart of the SPX:VIX ratio.
If we see a rally in the ES next week, this ratio will need to regain and hold above, firstly, 80, then 100, to convince me that any further strength is sustainable.
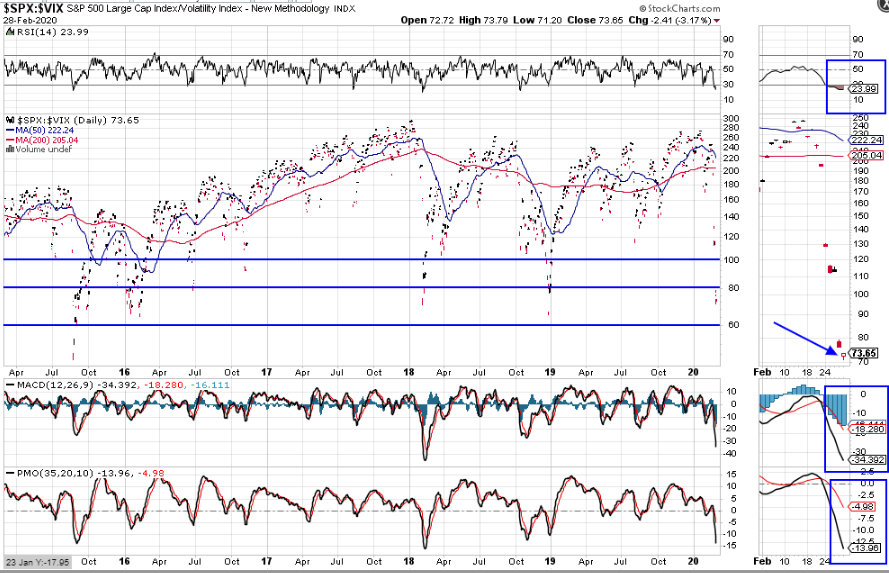
Otherwise, a further drop towards 60 will also drag the ES down to, potentially, retest the TPO POC (2888) and Friday's low (2853), or lower to, at least, 2790.
Originally published Friday, February 28, 2020
Trading in financial instruments and/or cryptocurrencies involves high risks including the risk of losing some, or all, of your investment amount, and may not be suitable for all investors. Prices of cryptocurrencies are extremely volatile and may be affected by external factors such as financial, regulatory or political events. Trading on margin increases the financial risks.
Before deciding to trade in financial instrument or cryptocurrencies you should be fully informed of the risks and costs associated with trading the financial markets, carefully consider your investment objectives, level of experience, and risk appetite, and seek professional advice where needed.
Fusion Media would like to remind you that the data contained in this website is not necessarily real-time nor accurate. The data and prices on the website are not necessarily provided by any market or exchange, but may be provided by market makers, and so prices may not be accurate and may differ from the actual price at any given market, meaning prices are indicative and not appropriate for trading purposes. Fusion Media and any provider of the data contained in this website will not accept liability for any loss or damage as a result of your trading, or your reliance on the information contained within this website.
It is prohibited to use, store, reproduce, display, modify, transmit or distribute the data contained in this website without the explicit prior written permission of Fusion Media and/or the data provider. All intellectual property rights are reserved by the providers and/or the exchange providing the data contained in this website.
Fusion Media may be compensated by the advertisers that appear on the website, based on your interaction with the advertisements or advertisers.