U.S. Treasurys And Gold: Odd Couple In Relative Correlation
David Tablish | Jan 25, 2017 12:54AM ET
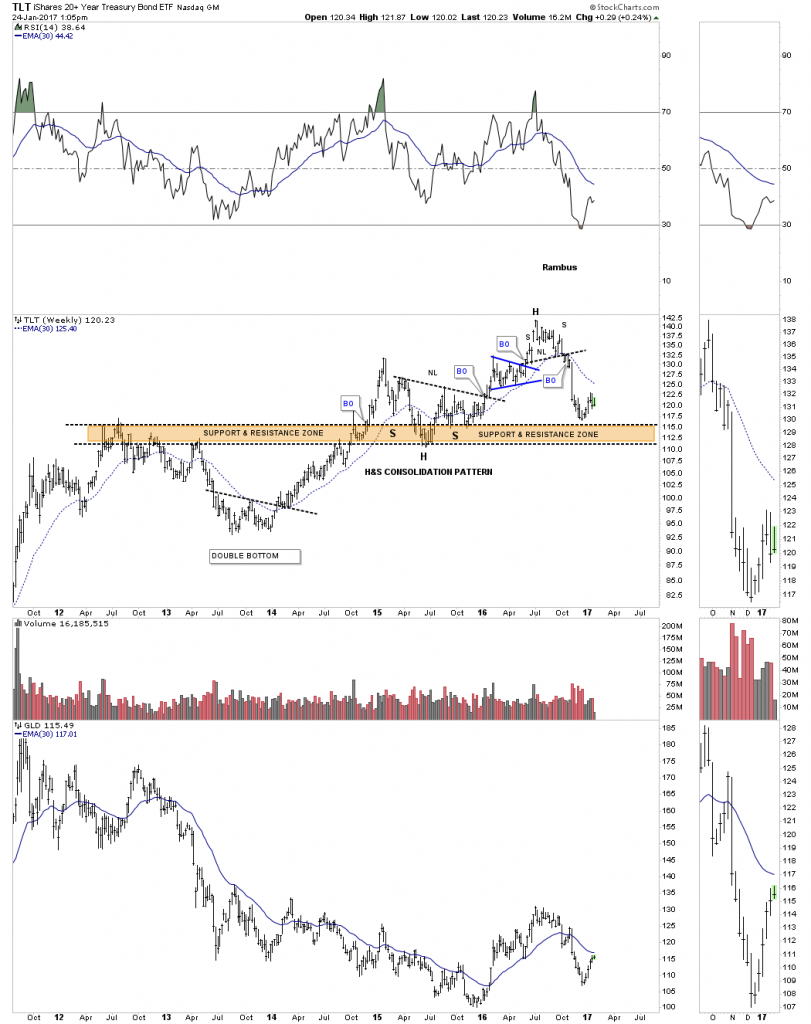
Lets start by looking at a weekly chart for iShares 20+ Year Treasury Bond Fund (NASDAQ:TLT), the 20 year bond ETF, which shows it built out a H&S top last summer. That H&S top is a reversal pattern that showed up at the end of its bull market which has been going on for many years.
There is a big brown shaded support and resistance zone that has been offering support.
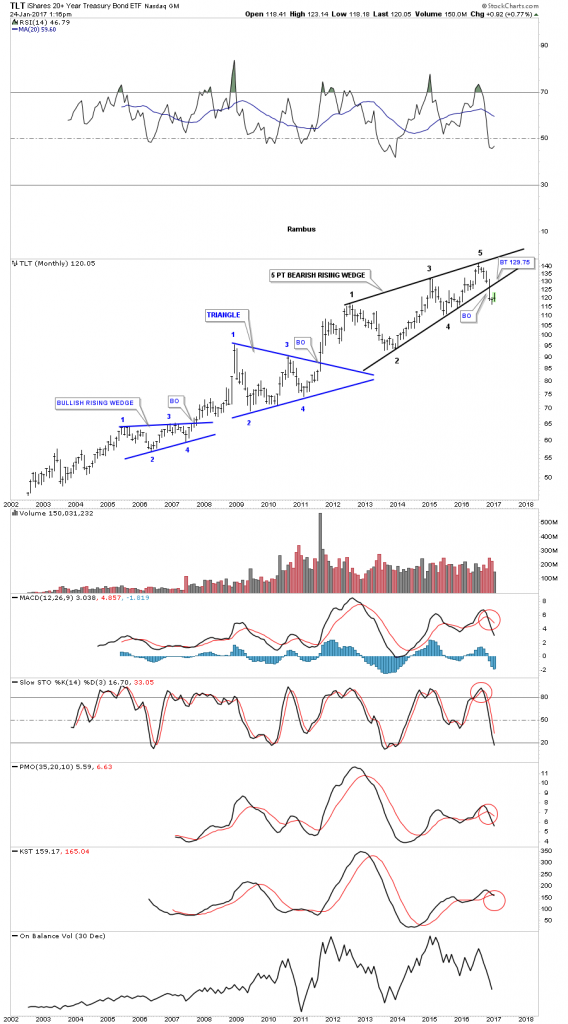
This next chart is a 15-year monthly look at the TLT which shows it has built out a four year, 5-point bearish rising wedge which broke to the downside in November of last year. If there is a backtest it would come in around the 129.75 area.
Direxion Daily 20+ Year Treasury Bear 3X Shares Fund (NYSE:TMV) is a 3 X short of the TLT.
This last chart is a combo chart which has the TLT on top and SPDR Gold Shares (NYSE:GLD) on the bottom. It’s not a perfect correlation by any means, but these two have been moving together pretty consistently over the last year or so.
GLD is currently backtesting its neckline and a support and resistance line going back a year and a half or so. If GLD can trade back above the neckline and the S&R line, the bulls will be talking to us. To say this is a critical area for GLD is an understatement. Definitely an area to keep a close eye on.
Trading in financial instruments and/or cryptocurrencies involves high risks including the risk of losing some, or all, of your investment amount, and may not be suitable for all investors. Prices of cryptocurrencies are extremely volatile and may be affected by external factors such as financial, regulatory or political events. Trading on margin increases the financial risks.
Before deciding to trade in financial instrument or cryptocurrencies you should be fully informed of the risks and costs associated with trading the financial markets, carefully consider your investment objectives, level of experience, and risk appetite, and seek professional advice where needed.
Fusion Media would like to remind you that the data contained in this website is not necessarily real-time nor accurate. The data and prices on the website are not necessarily provided by any market or exchange, but may be provided by market makers, and so prices may not be accurate and may differ from the actual price at any given market, meaning prices are indicative and not appropriate for trading purposes. Fusion Media and any provider of the data contained in this website will not accept liability for any loss or damage as a result of your trading, or your reliance on the information contained within this website.
It is prohibited to use, store, reproduce, display, modify, transmit or distribute the data contained in this website without the explicit prior written permission of Fusion Media and/or the data provider. All intellectual property rights are reserved by the providers and/or the exchange providing the data contained in this website.
Fusion Media may be compensated by the advertisers that appear on the website, based on your interaction with the advertisements or advertisers.