This Is Nuts…Again. Reducing Risk As Tech Goes 1999
Lance Roberts | Jul 12, 2020 03:51AM ET
Twice In One Year
It is a bit hard to comprehend that twice, in the same year, I would be writing primarily the same article.
In early January, I penned the following:
“When you sit down with your portfolio management team, and the first comment made is ‘this is nuts,’ it’s probably time to think about your overall portfolio risk. On Friday, that was how the investment committee both started and ended – ‘this is nuts.'”
At that time, I tweeted the following chart, which compared the Nasdaq to the S&P 500 index. The bands on both charts are 2-standard deviations of the 200-WEEK moving average. there are a couple of things which should jump out immediately:
- The near-vertical price acceleration in the markets has been a historical hallmark of late-stage cycle advances, also known as a “melt-up” phase.
- When markets get more than 2-standard deviations above their long-term moving average, reversions to the mean have tended to follow shortly after that.
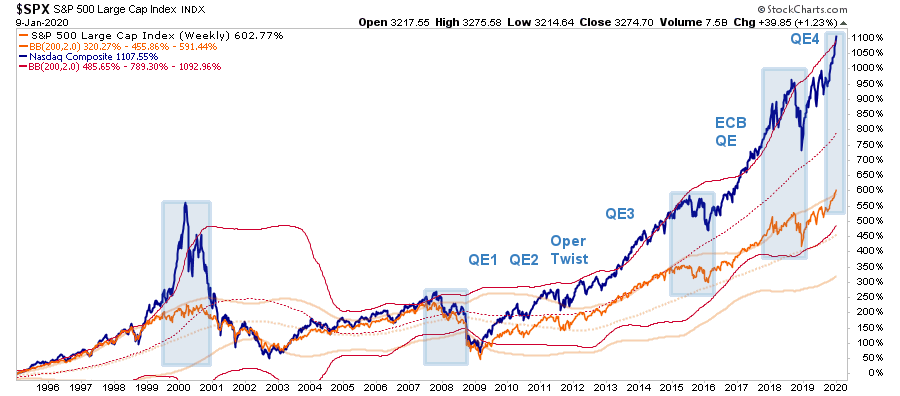
That was so 6-months ago.
Here is where we are today.
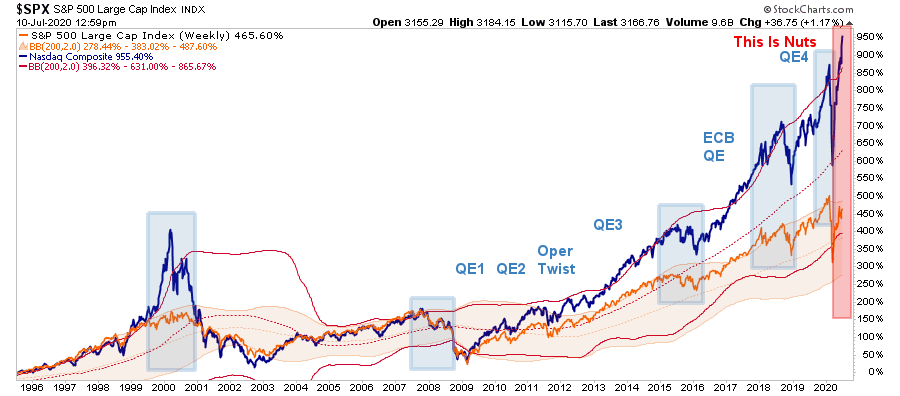
As I warned then, not only has the price of the Nasdaq gone parabolic, this time it is pushing 3-standard deviations of the 200-dma.
Fundamentally Detached
The divergence is particularly notable when you consider the economic and fundamental differences between now and then. (While we are discussing the Nasdaq, to maintain consistency with previous reports, I am using earnings estimates for the S&P 500 to show the relative change.)
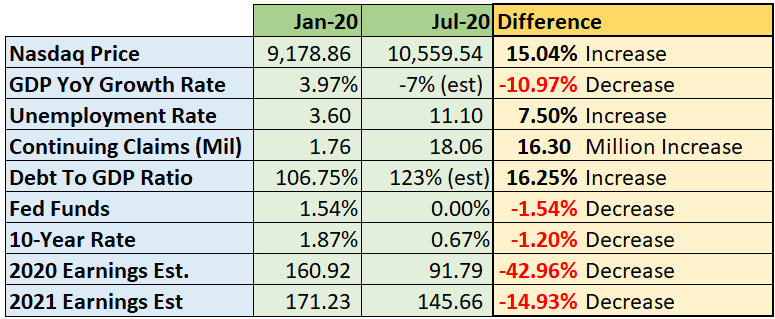
When looking at the acceleration in the price of the Nasdaq, and particularly within the small group of stocks driving that advance, you can begin to fathom our concerns. Furthermore, the divergence between the Nasdaq and the S&P 500 index is emulating the late 90’s. (The horizontal red line is where the ratio was last Friday just for perspective.)
Optimism in the Nasdaq 100 has also reached levels of exuberance seen only once previously in the last 25 years. Yep…the late 90’s.
Yes, “This Is Nuts.”
For the second time in a single year, we have begun the profit-taking process within our most profitable names. Apple (NASDAQ:AAPL), Microsoft (NASDAQ:MSFT), Netflix (NASDAQ:NFLX), Amazon (NASDAQ:AMZN), Costco (NASDAQ:COST), Procter & Gamble Company (NYSE:PG), and in Communications and Technology ETF’s.
(Note: Taking profits does not mean we sold the entire position. It means we reduced the amount of our holdings to protect our gains.)
As discussed in this week’s #MacroView (below), the “bearish case” does have “teeth” and should not be summarily dismissed. As Doug Kass noted this past Monday:
“Several key labor-intensive industries – education, lodging, entertainment (Broadway events, concerts, movie theaters, sporting events), restaurant, travel, retail, non-residential real estate, etc. – face an existential threat to their core. For these industries, they simply cannot survive the conditions they face. For these gutted industries, we face, at best, an 80% to 85% recovery in the years to come. It should be emphasized that Covid-19 just sped up what was already a secular decline.”
When the market historically becomes this detached from the underlying fundamentals, reversions tend to happen fairly quickly.
A Very Narrow Market
We recently added a new service with institutional money manager Jeffrey Marcus of Turning Point Analytics (TPA). One of his latest notes to subscribers drove home the point we are discussing now. To wit:
“It seems like we have dodged a bullet, yet a look under the surface reveals a much sicker market. The relative performance chart below shows that while the S&P 500 is still down 1.88%, but TPA’s BIGTECH Index (the top 8 stock in the NASDAQ 100 by market cap)is up an astonishing 48.99% year to date (YTD).
The table below shows that these 8-stocks represent $8 trillion in market cap, which is 29% of the market cap of the S&P 500 ($27.3 trillion). TPA ran the numbers to see just what effect these 8 stocks have had on an index of 500 stocks. The BIGTECH effect has been to add 8.71% of performance to the S&P 500 YTD.
Just A Handful Of Stocks
At the time of the analysis, the S&P 500 is down 1.88% for the year. Without the BIGTECH stocks, the benchmark would be down 10.5% in 2020.
We have mentioned this before, but a healthy rally is one with broad participation. The current rally is very narrow, historically dependent on less than 2% of the S&P 500 member stocks. Such means the overall performance of the S&P 500 is not representative of the market as a whole. It also means the index performance hinges on a very small group of stocks.
In addition, TPA Canaries in the Coalmine (table below) shows that the 14-day RSI of the ratio of BIGTECH/S&P 500 is also at 70.87. That RSI level denotes that BIGTECH is overbought relative to the S&P 500. At this juncture, one of two things can happen to make the BIGTECH/S&P 500 ratio less overbought:
- Stocks other than BIGTECH can rise faster than BIGTECH; or,
- BIGTECH can fall.
Given how much BIGTECH has meant to S&P 500 performance, investors should pray for the former.”
Here is a visual of what Jeff is talking about.
Throughout history, whenever there seems to be a “Can’t Lose Bet” in the financial markets, you are essentially guaranteed to “Lose Money.”
Updating Risk/Reward Ranges
As noted by Sentiment Trader this past week, the CNN Fear/Greed Proxy has turned down recently from very high readings. While this does NOT suggest stocks will crash, it does indicate over the next few weeks returns will likely be more muted with increased volatility.
With this in mind we can update our risk/reward ranges for next week.
As noted last week:
“The rally reversed much of the short-term oversold condition. While the bulls are in control of the market currently, the upside is somewhat limited. However, the downside risks are reduced with the improvement in the technical underpinnings. Such puts the risk/reward dynamics to a more equally balanced, than opportunistic, positioning. As such, risk controls and hedges should remain for now.”
That advice played out well this past week, given daily swings in the market. While the market was up for the week, it has not reclaimed the June highs. As such, the consolidation continues with risk/reward remaining primarily “neutral” with a “negative” bias.
- -2.6% to breakout level vs. +1.1% previous rally peak. (Neutral)
- -4.5 to 5.4% to 50 & 200 dma support vs. +4.0% to January peak (Neutral)
- -7.9% to previous consolidation peak vs. +5.5% to all-time highs. (Negative)
- -14.2% to previous consolidation lows vs. +5.5% to all-time highs. (Negative)
Reason To Focus On Risk
It seems appropriate to restate something I wrote the last time we saw these types of divergences.
“Our job as investors is to navigate the waters within which we currently sail, not the waters we think we will sail in later. Higher returns come from the management of ‘risks’ rather than the attempt to create returns by chasing markets. Robert Rubin, former Secretary of the Treasury, defined this philosophy when he stated;
‘As I think back over the years, I have been guided by four principles for decision making. The only certainty is that there is no certainty. Second, every decision, as a consequence, is a matter of weighing probabilities. Third, despite uncertainty, we must decide and we must act. And lastly, we need to judge decisions not only on the results but also on how we made them.
Most people are in denial about uncertainty. They assume they’re lucky, and that the unpredictable can be reliably forecasted. Such keeps business brisk for palm readers, psychics, and stockbrokers, but it’s a terrible way to deal with uncertainty. If there are no absolutes, all decisions become matters of judging the probability of different outcomes, and the costs and benefits of each. Then, on that basis, you can make a good decision.'”
An Honest Assessment
It should be evident that an honest assessment of uncertainty leads to better decisions. Still, the benefits of Rubin’s approach, and mine, goes beyond that. For starters, although it may seem contradictory, embracing uncertainty reduces risk, while denial increases it. Another benefit of acknowledged uncertainty is it keeps you honest.
“A healthy respect for uncertainty and focus on probability drives you never to be satisfied with your conclusions. It keeps you moving forward to seek out more information, to question conventional thinking and to continually refine your judgments and understanding that difference between certainty and likelihood can make all the difference.” – Robert Rubin
We must be able to recognize and be responsive to changes in underlying market dynamics. If they change for the worse, we must be aware of the inherent risks in portfolio allocation models. The reality is that we can’t control outcomes. The most we can do is influence the probability of specific outcomes. Such is why we manage risk by investing on probabilities rather than possibilities.
Such is essential not only to capital preservation but to investment success over time.
Trading in financial instruments and/or cryptocurrencies involves high risks including the risk of losing some, or all, of your investment amount, and may not be suitable for all investors. Prices of cryptocurrencies are extremely volatile and may be affected by external factors such as financial, regulatory or political events. Trading on margin increases the financial risks.
Before deciding to trade in financial instrument or cryptocurrencies you should be fully informed of the risks and costs associated with trading the financial markets, carefully consider your investment objectives, level of experience, and risk appetite, and seek professional advice where needed.
Fusion Media would like to remind you that the data contained in this website is not necessarily real-time nor accurate. The data and prices on the website are not necessarily provided by any market or exchange, but may be provided by market makers, and so prices may not be accurate and may differ from the actual price at any given market, meaning prices are indicative and not appropriate for trading purposes. Fusion Media and any provider of the data contained in this website will not accept liability for any loss or damage as a result of your trading, or your reliance on the information contained within this website.
It is prohibited to use, store, reproduce, display, modify, transmit or distribute the data contained in this website without the explicit prior written permission of Fusion Media and/or the data provider. All intellectual property rights are reserved by the providers and/or the exchange providing the data contained in this website.
Fusion Media may be compensated by the advertisers that appear on the website, based on your interaction with the advertisements or advertisers.