This Chart Shows When Gold Stocks Will Explode
Jordan Roy-Byrne, CMT | May 31, 2021 12:09AM ET
The rebounds in Gold and Silver exceeded my expectations and closed May in a strong fashion, near the highs of the month.
Gold’s monthly close was the third-highest ever. Silver failed to break resistance at $28.50, but its monthly close at $28 was the second-highest in the last eight years.
As noted last week, Gold and gold stocks have perked up in real terms. Gold relative to Bonds has broken out to a seven-year high. It has decoupled from Bonds. Also, both Gold and gold stocks have perked up against the stock market.
To understand immediate trends in precious metals, one must follow the various ratio charts. They can help us understand capital flows and anticipate the future.
Multiple ratio charts currently show potential for huge moves in Gold and gold stocks.
The answer to the title is the following chart.
We show VanEck Vectors Gold Miners ETF (NYSE:GDX) against Gold and VanEck Vectors Junior Gold Miners ETF (NYSE:GDXJ) against Gold.
GDX against Gold could be as soon as several months away from a major breakout, and that would be followed by GDXJ breaking out against Gold.
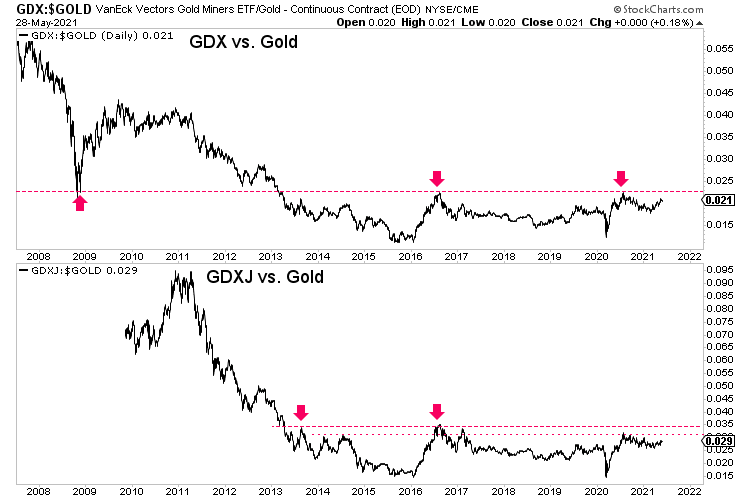
In other words, gold stocks are setting up for dramatic outperformance against Gold over the next year or two.
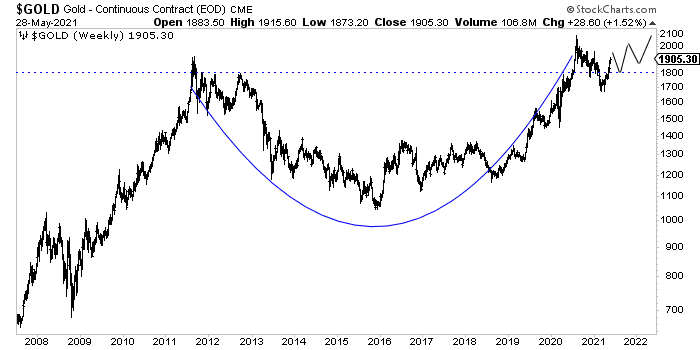
Oh, and the outlook for Gold isn't bad either. It’s only correcting and consolidating in the form of a larger, super-bullish cup and handle pattern.
The corrective low in gold stocks is definitely in as GDX and GDXJ successfully retested the multi-year breakouts they made last year.
After a successful retest of a significant breakout, a market typically trends higher in a steady and sustained fashion.
An early signal of the relative strength in gold stocks will be GDX breaking out relative to Gold, which may occur before Gold makes a new all-time high. In other words, gold stocks could make new highs before Gold.
Over the next year or two, we will witness something we haven’t seen in over 15 years.
Most market participants avoid gold stocks because of the crash of 2008 and devastating “forever” bear market and because of their consistent underperformance against Gold. As a result, generalist investors have preferred to own Gold instead of the miners.
This is an important shift, and it’s only in the first inning.
I’ve positioned myself in companies with the best combination of upside potential and fundamental quality. These are companies you can buy and hold for a few years that have the potential to be 5,7, and 10 baggers after Gold breaks past $2,100/oz.
Trading in financial instruments and/or cryptocurrencies involves high risks including the risk of losing some, or all, of your investment amount, and may not be suitable for all investors. Prices of cryptocurrencies are extremely volatile and may be affected by external factors such as financial, regulatory or political events. Trading on margin increases the financial risks.
Before deciding to trade in financial instrument or cryptocurrencies you should be fully informed of the risks and costs associated with trading the financial markets, carefully consider your investment objectives, level of experience, and risk appetite, and seek professional advice where needed.
Fusion Media would like to remind you that the data contained in this website is not necessarily real-time nor accurate. The data and prices on the website are not necessarily provided by any market or exchange, but may be provided by market makers, and so prices may not be accurate and may differ from the actual price at any given market, meaning prices are indicative and not appropriate for trading purposes. Fusion Media and any provider of the data contained in this website will not accept liability for any loss or damage as a result of your trading, or your reliance on the information contained within this website.
It is prohibited to use, store, reproduce, display, modify, transmit or distribute the data contained in this website without the explicit prior written permission of Fusion Media and/or the data provider. All intellectual property rights are reserved by the providers and/or the exchange providing the data contained in this website.
Fusion Media may be compensated by the advertisers that appear on the website, based on your interaction with the advertisements or advertisers.