The Yield Curve Dips Again, but Inflation Expectations Tell a Different Story
Brian Gilmartin | May 07, 2025 09:36AM ET
The first Great Conundrum was in the early 2000s after the 2001 – 2002 50% bear market in the SP 500 and the start of Gulf War II in March 2003. Alan Greenspan started hiking the fed funds rate (if memory serves correctly in 2004 – 2005 (?) but the Treasury yield curve started flattening out.
Rick Santelli, the great CNBC reporter would do live shots from the 30-year Treasury pit at the then-CBOT (Chicago Board of Trade), which is now part of the Chicago Mercantile Exchange (CME) and Rick kept citing the “+90% levels of bearishness” on the part of Treasury futures traders, and yet the long-end of the Treasury curve kept rallying in spite of all this.
I don’t know if Greenspan called it the “great conundrum” or just “the conundrum,” but what it was foreshadowing (ultimately) was 2007 and 2008, and the worst recession since the 1930s.
To put that period into context, the 2001 – 2002 bear market for the S&P 500 was only the 2nd 50% correction in the post-WW II period, and the first 50% correction since 1973 – 1974. Coming out of that in the early to mid-2000s, the Street expected a roaring economy under a Republican President (Bush 43), particularly given the fiscal stimulus from the Gulf War, and rising inflation (hence the bond bearishness), and it just never happened.
The 10-year Treasury yield rose from 3.5% in 2003 to 5% in 2007, but the move in early 1987 was much, much faster, and much more damaging.
The (2nd) Conundrum
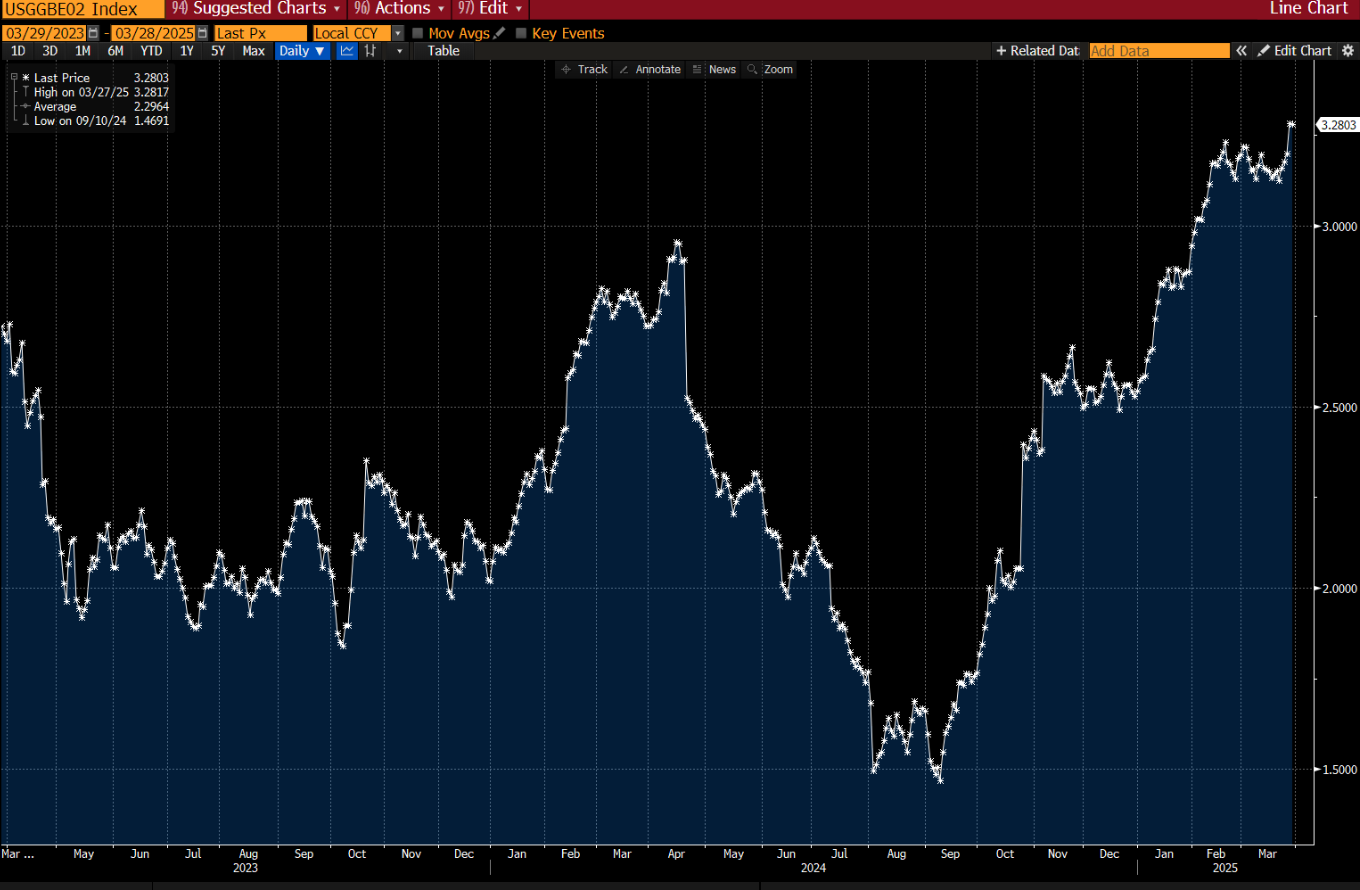
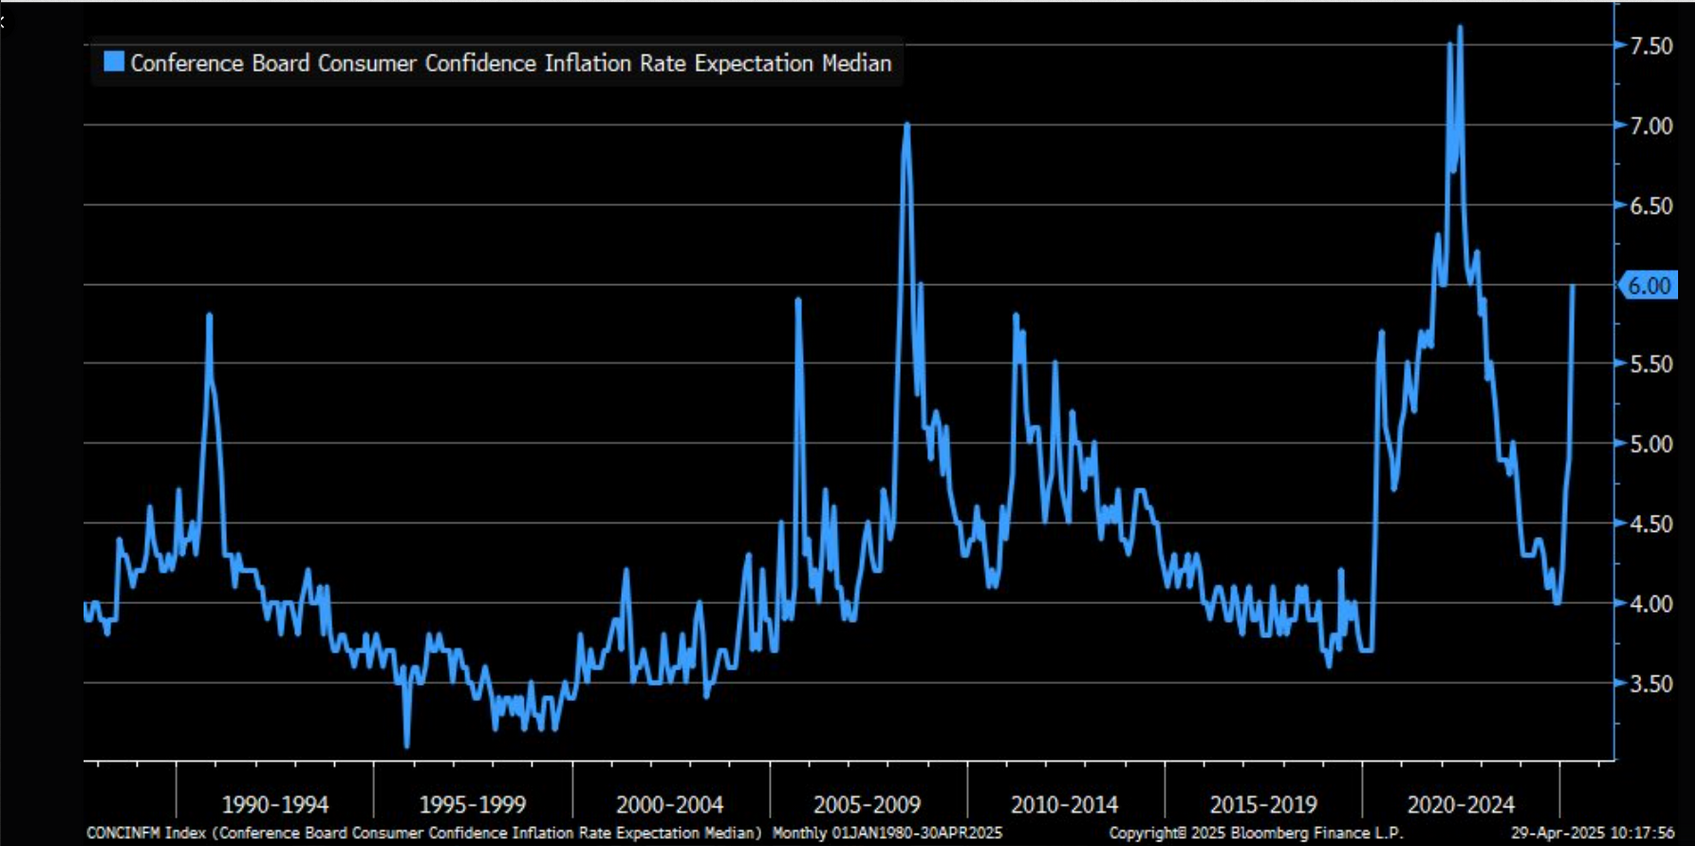
The chart above is from Lisa Abramowicz, who is a Bloomberg reporter and does a good job at it, and the graph is from late March ’25, and shows the rising inflation expectations “pre-Liberation Day” with the chart below being from LizAnn Sonders of Schwab, from an April 29th post on X, also showing rising inflation expectations.
Every economic and money and banking text educated me on how “inflation expectations” were always more critical to bond-market participants than actual inflation, which makes sense since “expectations” are forward-looking, but there is a definite disconnect today since the 10-year Treasury yield is down from 4.80% in January ’25, to 4.30% today.
Do you believe in “price” or the economic data?
What’s the disconnect telling us today? (Maybe nothing. Maybe it’s just how inflation expectations are measured.)
Conclusion
For a little fun and to use the historical comparison, the disconnect between inflation expectations and the 10-year Treasury yield isn’t being labelled a new conundrum yet, but it’s puzzling for sure.
In today’s FOMC statement, I truly wonder if Jay Powell will allude to the fact that if the President hadn’t set off the “tariff kerfuffle” as it’s been described, Jay Powell and the FOMC may have had adequate reason to start lowering the fed funds already, given the very good inflation data from the core CPI and the Core PCE from January to March ’25, AND the falling price of crude oil.
The Fed Chair is now forced to wait and see how the tariff policy changes impact pricing and thus inflation through the 2nd quarter and even into the 3rd quarter.
Disclaimer: None of this is advice or a recommendation but only an opinion. Past performance is no guarantee of future results. None of this information may be updated and if updated may not be done in a timely fashion.
Thanks for reading.
Trading in financial instruments and/or cryptocurrencies involves high risks including the risk of losing some, or all, of your investment amount, and may not be suitable for all investors. Prices of cryptocurrencies are extremely volatile and may be affected by external factors such as financial, regulatory or political events. Trading on margin increases the financial risks.
Before deciding to trade in financial instrument or cryptocurrencies you should be fully informed of the risks and costs associated with trading the financial markets, carefully consider your investment objectives, level of experience, and risk appetite, and seek professional advice where needed.
Fusion Media would like to remind you that the data contained in this website is not necessarily real-time nor accurate. The data and prices on the website are not necessarily provided by any market or exchange, but may be provided by market makers, and so prices may not be accurate and may differ from the actual price at any given market, meaning prices are indicative and not appropriate for trading purposes. Fusion Media and any provider of the data contained in this website will not accept liability for any loss or damage as a result of your trading, or your reliance on the information contained within this website.
It is prohibited to use, store, reproduce, display, modify, transmit or distribute the data contained in this website without the explicit prior written permission of Fusion Media and/or the data provider. All intellectual property rights are reserved by the providers and/or the exchange providing the data contained in this website.
Fusion Media may be compensated by the advertisers that appear on the website, based on your interaction with the advertisements or advertisers.