ETF’s, Futures Swing Trading Instructions Weekly: Dec 12th
Patrick MontesDeOca | Dec 13, 2016 10:53AM ET
The Weekly VC Price Momentum Indicator
Signals are automatically generated by integrating electronic prices and weekly statistics with proprietary algorithms.
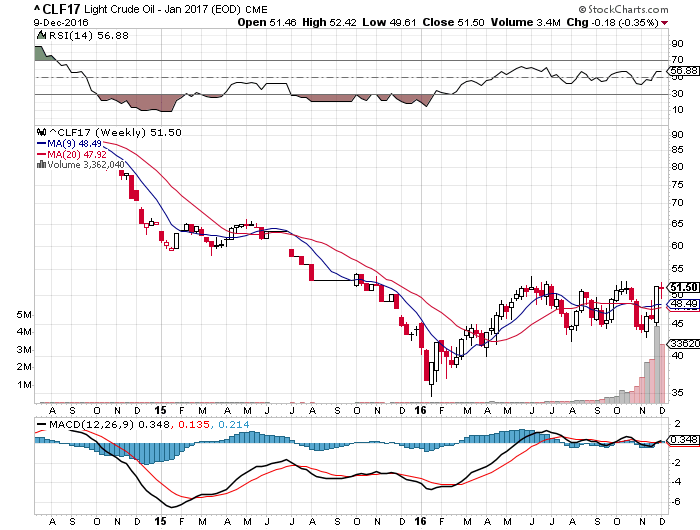
Crude Oil
WEEKLY SUMMARY
TREND MOMENTUM: 48.49 Bullish
PRICE MOMENTUM: 51.18 Bullish
PRICE INDICATOR
EXIT LONG:
S2) 53.99
S1) 52.74
EXIT SHORTS:
B1) 49.33
B2) 48.37
WEEKLY TREND MOMENTUM
The contract closed at 51.50 The market closing above the 9 SMA 48.44 is confirmation that the trend momentum is bullish. A close below the 9 SMA would negate the weekly bullish short-term trend to neutral.
WEEKLY PRICE MOMENTUM
With the market closing above The VC Weekly Price Momentum Indicator of 51.17 it confirms that the price momentum is bullish. A close below the VC Weekly, it would negate the bullish signal to neutral.
WEEKLY PRICE INDICATOR
Cover short on corrections at the 49.33 - 48.37 levels and go long on a weekly reversal stop. If long, use the 48.37 level as a Stop Close Only and Good Till Cancelled order. Look to take some profits on longs, as we reach the 52.74 - 53.99 levels during the week.
ES
WEEKLY SUMMARY
TREND MOMENTUM: 2163 Bullish
PRICE MOMENTUM: 2233 Bullish
PRICE INDICATOR
EXIT LONGS:
2) 2315
1) 2288
EXIT SHORTS:
1) 2206
2) 2151
WEEKLY TREND MOMENTUM
The contract closed at 2260. The market closing above the 9 SMA 2163 is confirmation that the trend momentum is bullish. A close below the 9 SMA would negate the weekly bearish short-term trend to neutral.
WEEKLY PRICE MOMENTUM
With the market closing above The VC Weekly Price Momentum Indicator of 2233 it confirms that the price momentum is bullish. A close below the VC Weekly, it would negate the bullish signal to neutral.
WEEKLY PRICE INDICATOR
Cover short on corrections at the 2206 - 2151 levels and go long on a weekly reversal stop. If long, use the 2151 level as a Stop Close Only and Good Till Cancelled order. Look to take some profits on longs, as we reach the 2288 - 2315 levels during the week.
First Mining Finance Corp (V:FF)
WEEKLY SUMMARY
TREND MOMENTUM: 0.79 Bullish
PRICE MOMENTUM: 0.83 Bearish
PRICE INDICATOR
EXIT LONGS:
S2) 0.98
S1) 0.89
EXIT SHORTS
B1) 0.74
B2) 0.68
WEEKLY TREND MOMENTUM
The contract closed at 0.81. The market closing above the 9 SMA 0.79 is confirmation that the trend momentum is bullish. A close below the 9 SMA would negate the weekly bullish short-term trend to neutral.
WEEKLY PRICE MOMENTUM
With the market closing below The VC Weekly Price Momentum Indicator of 0.83 it confirms that the price momentum is bearish. A close above the VC Weekly, it would negate the bearish signal to neutral.
WEEKLY PRICE INDICATOR
Cover short on corrections at the 0.74 - 68 levels and go long on a weekly reversal stop. If long, use the 0.68 level as a Stop Close Only and Good Till Cancelled order. Look to take some profits on longs, as we reach the 0.89 - 0.98 levels during the week.
McEwen Mining Inc. (TO:MUX)
WEEKLY SUMMARY
TREND MOMENTUM: 3.06 Bearish
PRICE MOMENTUM: 3.05 Bearish
PRICE INDICATOR
EXIT LONGS:
2) 3.44
1) 3.19
EXIT SHORTS
2.80
2.66
WEEKLY TREND MOMENTUM
The contract closed at 2.95 The market closing below the 9 SMA 3.06 is confirmation that the trend momentum is bearish. A close above the 9 SMA would negate the weekly bearish short-term trend to neutral.
WEEKLY PRICE MOMENTUM
With the market closing below The VC Weekly Price Momentum Indicator of 3.05 it confirms that the price momentum is bearish. A close above the VC Weekly, it would negate the bearish signal to neutral.
WEEKLY PRICE INDICATOR
Cover short on corrections at the 2.80 - 2.66 levels and go long on a weekly reversal stop. If long, use the 2.66 level as a Stop Close Only and Good Till Cancelled order. Look to take some profits on longs, as we reach the 3.19 - 3.44 levels during the week.
Direxion Daily Junior Gold Miners Bull 3X Shares (NYSE:JNUG)
WEEKLY SUMMARY
TREND MOMENTUM: 9.12 Bearish
PRICE MOMENTUM: 6.94 Bearish
PRICE INDICATOR
EXIT LONGS:
2) 8.55
1) 7.52
EXIT SHORTS:
5.90
5.33
WEEKLY TREND MOMENTUM
The contract closed at 6.50 The market closing below the 9 SMA 9.12 is confirmation that the trend momentum is bearish. A close above the 9 SMA would negate the weekly bearish short-term trend signal to neutral.
WEEKLY PRICE MOMENTUM
With the market closing below The VC Weekly Price Momentum Indicator of 6.94 it confirms that the price momentum is bearish. A close above the VC Weekly, it would negate the bearish signal to neutral.
WEEKLY PRICE INDICATOR
Cover short on corrections at the 6.54 - 5.77 levels and go long on a weekly reversal stop. If long, use the 5.77 as a Stop Close Only and Good Till Cancelled order. Look to take some profits on longs, as we reach the 7.73 - 8.16 levels during the week.
Direxion Daily Gold Miners Bull 3X Shares (NYSE:NUGT)
WEEKLY SUMMARY
TREND MOMENTUM: 10.52 Bearish
PRICE MOMENTUM: 8.05 Bullish
PRICE INDICATOR
EXIT LONGS
2) 9.49
1) 8.59
EXIT SHORTS
1) 7.15
2) 6.61
WEEKLY TREND MOMENTUM
The contract closed at 8.69 The market closing bel0w the 9 SMA 10.52 is confirmation that the trend momentum is bearish. A close above the 9 SMA would negate the weekly bearish short-term trend to neutral.
WEEKLY PRICE MOMENTUM
With the market closing above The VC Weekly Price Momentum Indicator of 8.05, it confirms that the price momentum is bullish. A close below the VC Weekly, it would negate the bullish signal to neutral.
WEEKLY PRICE INDICATOR
Cover short on corrections at the 7.15 - 6.61 levels and go long on a weekly reversal stop. If long, use the 6.61 level as a Stop Close Only and Good Till Cancelled order. Look to take some profits on longs, as we reach the 8.59 9.49 levels during the week.
VelocityShares 3x Long Silver linked to S&P GSCI Silver ER Exp 14 Oct 2031 (NASDAQ:USLV)
WEEKLY SUMMARY
TREND MOMENTUM: 15.31 Bearish
PRICE MOMENTUM: 13.95 Bearish
PRICE INDICATOR
EXIT LONGS:
2) 15.73
1) 14.79
EXIT SHORTS
1) 13.01
2) 12.17
WEEKLY TREND MOMENTUM
The contract closed at 13.86. The market closing below the 9 SMA 15.31 is confirmation that the trend momentum is bearish. A close above the 9 SMA would negate the weekly bullish short-term trend to neutral.
WEEKLY PRICE MOMENTUM
With the market closing below The VC Weekly Price Momentum Indicator of 13.95, it confirms that the price momentum is bearish. A close above the VC Weekly, it would negate the bearish signal to neutral.
WEEKLY PRICE INDICATOR
Cover short on corrections at the 13.01 - 12.17 levels and go long on a weekly reversal stop. If long, use the 12.17 level as a Stop Close Only and Good Till Cancelled order. Look to take some profits on longs, as we reach the 14.79 - 15.73 levels during the week.
ProShares Ultra Silver (NYSE:AGQ)
WEEKLY SUMMARY
TREND MOMENTUM: 38.73 Bearish
PRICE MOMENTUM: 35.23 Bullish
PRICE INDICATOR:
EXIT LONGS:
1) 37.33
1) 36.50
EXIT SHORTS
1) 34
2) 33
WEEKLY MOVING AVERAGES
The contract closed at 36.24. The market closing below the 9 SMA 38.34 is confirmation that the trend momentum is bearish. A close above the 9 SMA would negate the weekly bearish short-term trend to neutral.
WEEKLY MOMENTUM INDICATOR
With the market closing below The VC Weekly Price Momentum Indicator of 36.34, it confirms that the price momentum is bearish. A close above the VC Weekly, it would negate the bearish signal to neutral.
WEEKLY PRICE INDICATOR
Cover short on corrections at the 34.78 - 33 levels and go long on a weekly reversal stop. If long, use the 33 level as a Stop Close Only and Good Till Cancelled order. Look to take some profits on longs, as we reach the 37.78 - 39.36 levels during the week.
*Disclaimer: The information in the Market Commentaries was obtained from sources believed to be reliable, but we do not guarantee its accuracy. Neither the information nor any opinion expressed herein constitutes a solicitation of the purchase or sale of any futures or options contracts.
Trading in financial instruments and/or cryptocurrencies involves high risks including the risk of losing some, or all, of your investment amount, and may not be suitable for all investors. Prices of cryptocurrencies are extremely volatile and may be affected by external factors such as financial, regulatory or political events. Trading on margin increases the financial risks.
Before deciding to trade in financial instrument or cryptocurrencies you should be fully informed of the risks and costs associated with trading the financial markets, carefully consider your investment objectives, level of experience, and risk appetite, and seek professional advice where needed.
Fusion Media would like to remind you that the data contained in this website is not necessarily real-time nor accurate. The data and prices on the website are not necessarily provided by any market or exchange, but may be provided by market makers, and so prices may not be accurate and may differ from the actual price at any given market, meaning prices are indicative and not appropriate for trading purposes. Fusion Media and any provider of the data contained in this website will not accept liability for any loss or damage as a result of your trading, or your reliance on the information contained within this website.
It is prohibited to use, store, reproduce, display, modify, transmit or distribute the data contained in this website without the explicit prior written permission of Fusion Media and/or the data provider. All intellectual property rights are reserved by the providers and/or the exchange providing the data contained in this website.
Fusion Media may be compensated by the advertisers that appear on the website, based on your interaction with the advertisements or advertisers.