The Week In The US : Spring Break
BNP Paribas | Apr 05, 2013 07:26AM ET
Surveys (national and regional) send contradictory signals, yet it is too early to say whether they point to consolidation or the first signs of a slowdown. Employment figures tend to support the second analysis. But a singler month is not enough to draw a trend.
The ISM index for the manufacturing sector was released early in the week. After rising for three consecutive months, from 49.9 in November to 54.2 in February, the index dropped 2.9 points in March, a much sharper decline than expected. Production and new orders, the components1 that had increased the most between November and February, were also the ones that fell sharpest in March. The production component is now slightly lower than it was four months ago (by 0.9 points to 52.2), and the new orders component is slightly higher (by 0.3 points to 51.4). The composite index remains 1.4 points higher than November’s low, thanks solely to inventories and employment.
Since 2010, the United States has followed a jagged growth profile, starting each year on a promising note followed by a slowdown in the spring or summer months before rebounding again in late autumn. At the most recent press conference following the FOMC meeting of 19 and 20 March, Ben Bernanke mentioned the risk of the U.S. economy experiencing a similar seasonal trend.
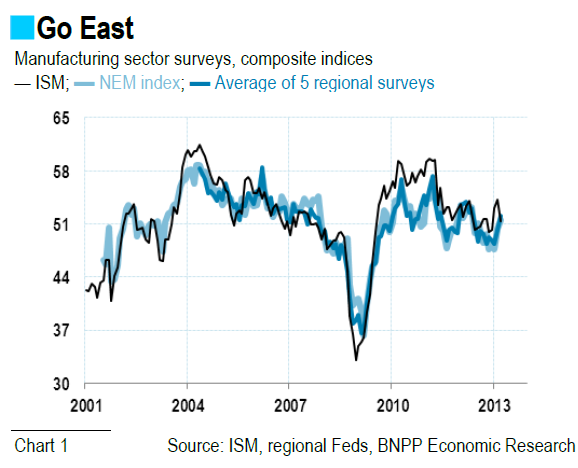
We find it difficult to announce a slowdown based solely on a single month. Survey data must always be put into perspective, even those of the ISM. The regional surveys are not all sending out the same signals, such as the Chicago area, where the automobile industry predominates. Of the twelve regional Feds, five conduct surveys of manufacturing activity in their district. The New York and Philadelphia Feds are the first to publish their results, which we use to construct our North East Manufacturing (NEM) index. As shown in chart 1, our NEM index moves exactly in line with the weighted sum of all the other regional data2, which illustrates the great diversity of manufacturing in this area of the United States. Chart 1 also highlights the divergence between national ISM and the regional surveys: after rebounding more rapidly than the regional indexes, the ISM index has only corrected its excessive optimism to rejoin the level of confidence suggested at the regional level.
The decline in the ISM non-manufacturing index lends greater credibility to the scenario of a spring slowdown. The composite index declined 1.6 points, but remains comfortably above the 50 threshold (at 54.4). Its components have followed very different trends from those in the manufacturing sector survey: production held steady at 56.5 in March (compared to 56.9 in February) but employment declined sharply to 53.3 (from 57.2). As a whole, the economy seems to have marked a pause in March, as shown by the 1.7 points decline in our M&N index (the weighted sum of data from the two ISM surveys). The quarterly average points to stabilisation at a strong level, with the M&N index rising to 54.9 in Q1 2013 from 54.5 in Q4 2012. This supports our growth forecast for the first part of the year (+3.3% at an annualised quarterly rate).
In 2010, the spring slowdown was due to the emergence of the eurozone’s sovereign debt crisis. In 2011, it was caused by the combination of surging oil prices following the Arab Spring, and global supply chain disruptions triggered by the Fukushima disaster. In 2012, the abrupt slowdown in job creations strained the momentum of disposable income, resulting in slower growth of household consumption.
We are back again at the job market situation. U.S. export prospects do not seem to be suffering much from the European recession. New export orders are one of the more upbeat components of the ISM surveys, while low inflation continues to boost disposable income. Once again, employment is key if consumer spending is to maintain its momentum. To that matter, the March labour market report was a huge disappointment, with a marked slowdown in job creations (88k versus a 3-month average of 212k as of February), a deceleration in wage growth (at +1.8% y/y, after an average of +2.1% over the previous three months, another fall in the labour participation ratio (to 63.3%, the lowest since 1979) and a lengthening of the duration of unemployment (the median duration came up to 18.1 week. However, the whole report is not bad. The unemployment rate once more declined to 7.6% (from 7.7% in February and 7.9% in January) and the number of persons intentionally leaving their jobs, which is usually a sign of confidence in their ability to find a new and better position in a short period of time. But the ultimate reassuring point is that the index of aggregate hours worked increased by 3.5% (3-month annualised rate). This index is a rather good proxy of economic growth, meaning that activity did not stall in March.
BY Alexandra ESTIOT
Trading in financial instruments and/or cryptocurrencies involves high risks including the risk of losing some, or all, of your investment amount, and may not be suitable for all investors. Prices of cryptocurrencies are extremely volatile and may be affected by external factors such as financial, regulatory or political events. Trading on margin increases the financial risks.
Before deciding to trade in financial instrument or cryptocurrencies you should be fully informed of the risks and costs associated with trading the financial markets, carefully consider your investment objectives, level of experience, and risk appetite, and seek professional advice where needed.
Fusion Media would like to remind you that the data contained in this website is not necessarily real-time nor accurate. The data and prices on the website are not necessarily provided by any market or exchange, but may be provided by market makers, and so prices may not be accurate and may differ from the actual price at any given market, meaning prices are indicative and not appropriate for trading purposes. Fusion Media and any provider of the data contained in this website will not accept liability for any loss or damage as a result of your trading, or your reliance on the information contained within this website.
It is prohibited to use, store, reproduce, display, modify, transmit or distribute the data contained in this website without the explicit prior written permission of Fusion Media and/or the data provider. All intellectual property rights are reserved by the providers and/or the exchange providing the data contained in this website.
Fusion Media may be compensated by the advertisers that appear on the website, based on your interaction with the advertisements or advertisers.