The Week Ahead: More 'Experts' Predicting A Market Top
Jeff Miller | Jan 19, 2014 03:13AM ET
Most potential stock investors have been bruised by events over the last decade. They are receptive to a message of fear, and many pundits are happy to satisfy their urges. Calling for a major market turn can be very profitable for the pundit. This is true even if the prediction is very early and the pundit never signals when to shift back.
With the stock market reaching new highs, there is no shortage of those eager to call the top.
Last Week Recap
Last week cites six ratios .
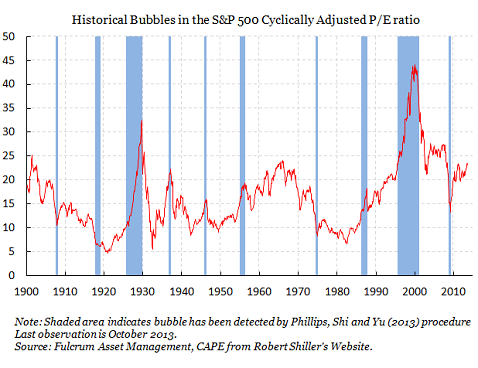
- Some methods see stocks as significantly undervalued. Jeremy Siegel sees another 10-15% just to reach fair value. Prices might not stop there because most investors are still not involved.
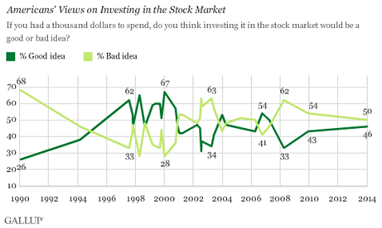
- Investors remain skeptical. Gallup surveys show that most people see this as a bad time to invest in stocks.
What should we make of this? To help us decide, we will have more earnings evidence this week.
As usual, I will provide some additional thoughts in the conclusion. I also have special emphasis on this topic in the Insight for Investors section. I have retooled this section to highlight fresh ideas each week while still providing links to continuing themes.
First, let us do our regular update of the last week's news and data. Readers, especially those new to this series, will benefit from reading the background information .
Last Week's Data
Each week I break down events into good and bad. Often there is "ugly" and on rare occasion something really good. My working definition of "good" has two components:
- The news is market-friendly. Our personal policy preferences are not relevant for this test. And especially -- no politics.
- It is better than expectations.
The Good
Some of the recent news was good.
- Bullish sentiment declined – a contrarian indicator. Here is the chart from Bespoke :
- Congress is reaching agreement on appropriations. I see progress in this. Stan Collender remains skeptical , seeing this as a one-time event.
- Earnings are less reliant on share buybacks. Not everyone was troubled by the buyback meme, but some wanted to see "real" earnings growth. This is a complicated story, covered very well by Cardiff Garcia . It deserves a careful reading.
- Inflation continues lower, perhaps influencing bond yields as well. It is not all about the taper. Izabella Kaminska has a thorough analysis , featuring this chart:
- Housing starts and building permits showed solid year-over-year gains, but the monthly change was a little soft. Calculated Risk sees the report as solid . I am following Bill McBride closely on this topic.
- Retail sales improved and beat expectations. Steven Hansen agrees , but is less than enthusiastic. The trading in retail stocks is also soft.
- Financial conditions are the best in two decades, analyze by Scott Grannis. This is consistent with my weekly reports on the SLFSI in the Quant Corner.
- The budget deficit decline continues. Scott Grannis analyzes the effects of economic growth, using several charts. This one is especially interesting:
The Bad
There was more bad news than we have recently seen.
Capitulation by the "hot money?" The National Association of Active Investment Managers uses survey data to reflect net long exposure. The "wobbly" according to earnings guru Brian Gilmartin. While the recent changes are still in normal ranges, he describes various thoughtful concerns in his most recent post. I watch Brian's earnings news very closely.
The Ugly
Shaky fingers on the nuclear trigger. Drug problems and cheating among those charged with firing ICBM's? It has a scary feel to it, but some wonder if this system is still even necessary. Gwen Ifill has a oldie but goodie from last October . I cite it now because of the continuing lame excuses by those who have been on the wrong side of their market forecasts. They all blame it on the Fed, as if that were not part of the mission in thinking about the economy and markets. This week's Barron's is the most recent case in point. Barry patiently explains the distinction between correlation and causation, showing how various fundamental factors have improved along with stocks. It is important to read the entire post, but here is a key quote:
There are a variety of reasons why I am unwilling to attribute the 100% suggestion. The first and most obvious is that markets are extremely complex, with all manner of psychological, valuation, trend as well as monetary inputs. The intricacy of equities is such that there is almost never any one single factor that causes major market moves in either directions. Invariably, there are a myriad factors that establish conditions, impact traders, affect how people interact that are the prime causes.
If you are willing to say the Fed is the cause of 100% of market gains, you are simultaneously implying that every other factor had a net zero impact. I simply don't buy that.
See also my own improvement in leading indicators for US growth, while highlighting danger areas worth monitoring. See the article for detailed charts on each indicator.
The Week Ahead
This is a very minor week for news and data.
The "A List" includes the following:
- Initial jobless claims (Th). Best fresh data on employment, more important than ever after last month's employment report.
- Leading indicators (Th). Some controversy in the background, but still widely followed.
- Existing home sales (Th). Perhaps less relevant than new construction for the economy, but strongly related.
The "B List" includes:
- FAFHA housing prices (Th). Good data, but only on qualifying loans. A different universe from Case/Shiller.
Mostly, the market will focus on earnings.
How to Use the Weekly Data Updates
In the WTWA series I try to share what I am thinking as I prepare for the coming week. I write each post as if I were speaking directly to one of my clients. Each client is different, so I have five different programs ranging from very conservative bond ladders to very aggressive trading programs. It is not a "one size fits all" approach.
To get the maximum benefit from my updates you need to have a self-assessment of your objectives. Are you most interested in preserving wealth? Or like most of us, do you still need to create wealth? How much risk is right for your temperament and circumstances?
My weekly insights often suggest a different course of action depending upon your objectives and time frames. They also accurately describe what I am doing in the programs I manage.
Insight for Traders
Felix has shifted to slightly bullish. Even over the last few "neutral" weeks we have been fully invested in the top three sectors. Felix's ratings have been in a fairly narrow range for several months. The rapid news-driven shifts are not the ideal conditions for Felix's three-week horizon. The ratings are slightly more positive, but many sectors are still in the penalty box.
Insight for Investors
I review the themes here each week and refresh when needed. For investors, as we would expect, the key ideas may stay on the list longer than the updates for traders. This is the "actionable investment advice" draws upon several sources to illustrate how the average investor underperforms a simple index. The post is full of good advice and great links. The key? Owning a good index with low costs is no solution for the temptations of human nature.
My advice to investors is to grant yourself a healthy distance from those who view investing from 30,000 feet. It's easy to wave your hand and say everything's overpriced and the Dow could go to 1,000. Instead, if you're interested in a company, start at the ground level and found out why it's successful.
Josh Brown explains why it is wrong to think of "new all-time highs" as scary. This is a great post, combining a practical knowledge of odds with Josh's insight into investor psychology. Here is a taste:
It means that no one has a loss in the stock or is "waiting to get back to even so they can sell".
It means that a host of people who had been waiting for that pullback to get in are now ripping their own skin off in aggravation.
It means that it is the new favorite stock of those who are long, one that they will not easily part with because it is now "one of their winners" and it "has been good to them".
It means the people who "bought small" are pissed even though they are up, these are the people sitting just below the offer like Tick Tock the crocodile loitering below Captain Hook's gangplank – just waiting for a bite.
…and much more.
This week I also published my Andrew Smithers in October, 2009 . (I owe someone a hat tip on this reference, but I lost the link).
I understand that circumstances change, models fail, and mistakes can be made. If you are serious about your investing, you will learn, improve, and move on. If your business model does not depend upon accurate results, you are free to indulge in stubbornness rather than ingenuity!
Trading in financial instruments and/or cryptocurrencies involves high risks including the risk of losing some, or all, of your investment amount, and may not be suitable for all investors. Prices of cryptocurrencies are extremely volatile and may be affected by external factors such as financial, regulatory or political events. Trading on margin increases the financial risks.
Before deciding to trade in financial instrument or cryptocurrencies you should be fully informed of the risks and costs associated with trading the financial markets, carefully consider your investment objectives, level of experience, and risk appetite, and seek professional advice where needed.
Fusion Media would like to remind you that the data contained in this website is not necessarily real-time nor accurate. The data and prices on the website are not necessarily provided by any market or exchange, but may be provided by market makers, and so prices may not be accurate and may differ from the actual price at any given market, meaning prices are indicative and not appropriate for trading purposes. Fusion Media and any provider of the data contained in this website will not accept liability for any loss or damage as a result of your trading, or your reliance on the information contained within this website.
It is prohibited to use, store, reproduce, display, modify, transmit or distribute the data contained in this website without the explicit prior written permission of Fusion Media and/or the data provider. All intellectual property rights are reserved by the providers and/or the exchange providing the data contained in this website.
Fusion Media may be compensated by the advertisers that appear on the website, based on your interaction with the advertisements or advertisers.