The State Of The Market In 5 Charts: November 2015 Edition
David Fabian | Nov 16, 2015 06:11AM ET
This week’s opening post is dedicated to a more wide-ranging overview of the global financial markets. The purpose of this analysis is to take a broader view of several key indices in order to reaffirm current trends or assess new opportunities. Without further preamble, let’s dive in…
Large Cap Stocks
The summer volatility and subsequent autumn recovery has run its course in the stock market. Furthermore, we have now entered a new phase of weakness in the broad-based SPDR S&P 500 ETF (N:SPY) that is likely causing some anxiety for the bulls who are counting on a Santa Claus rally to finish in the black.
SPY is virtually flat on a year-to-date basis and is now back below its 200-day moving average after briefly peeking above it in October. More importantly, this long-term moving average is now flattening and has proven to be a less reliable indicator of stock direction over the last several months.
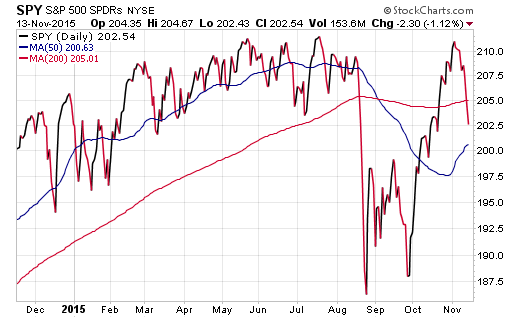
This recent weakness in November may just be stocks working off some of their overbought steam and setting up for a strong close to the year. Several breadth and sentiment indicators are now back to an oversold state that would appear to favor additional upside in the near-term. However, it’s worth noting that just because a stock index “appears” oversold doesn’t mean it can’t go down further.
Those that are looking to position their portfolio for another shot higher may be rewarded in the small cap arena, which has shown greater historical strength during this time of the year.
International Stocks
International stocks have been somewhat lost in the shuffle over the last several months, as the home-bias shifted to the weakness in the U.S. markets. Nevertheless, the well-known iShares MSCI EAFE ETF (N:EFA) will be in focus this week in the wake of the horrific terrorist attacks overseas.
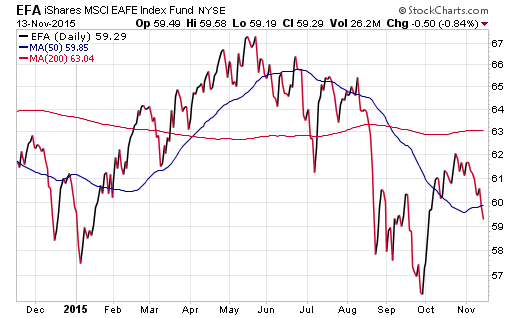
The recovery in EFA fell well short of expectations and the current trend remains in favor of weakness at the moment. This index was unable to recover back to its 200-day moving average and is now below even its short-term trend lines. The quantitative easing efforts in both Europe and Asia don’t appear to be making much of an impact on enthusiasm for international stocks as well.
U.S. Dollar Index
The strength in the PowerShares U.S. Dollar Index Bullish ETF (N:UUP) has likely been one of the thorns in the side of traditional international stock exposure. A strong dollar acts as a headwind for the stocks inside EFA and renews calls for currency-hedged exposure that profits from a falling euro and yen.
UUP tested its lower support zone several times over the last six months and was ultimately able to garner enough momentum for a shot higher. Many in the forex community are now reaffirming the uptrend in the U.S. dollar index, which may see its ripple effects spread to stocks and bonds as well.
Bonds
Bonds have reacted negatively to the expectation of a rate hike by the Federal Reserve in December, with interest rates rising modestly over the last two weeks. This has pushed the price of the iShares Core U.S. Aggregate Bond ETF (N:AGG) lower despite the overall weakness in stocks.
High yield corporate bonds in particular have continued to lead the charge on the downside. This is of concern for those that associate high yield credit appetite with stock market direction.
For the moment, high quality bonds appear to have lost their traditional shock absorber effect and the roiling seas at the lower end of the credit spectrum are quickly deteriorating. The one thing that would likely prop up bonds in the near term would be a dovish posturing by the Fed over the next month that takes the notion of an imminent rate hike off the table.
Commodities
The chart below is of the PowerShares DB Commodity Index Tracking Fund (N:DBC). This ETF tracks a basket of energy futures, precious metals, industrial metals, and even agriculture prices on a daily basis.
I’m sure someone could write a book on the technical and fundamental story behind this trend. Suffice it to say I will sum it up in four words: the bottom isn’t in. DBC has been the quintessential falling knife and I am still recommending that investors avoid this sector for the time being.
The Final Word
Much will be written this week about “global jitters” and I think the charts above accurately represent this euphemism. There is much at stake in the near-term with political wrangling, social unrest, central bank policy, and other factors playing a part in the daily price action.
My advice is to avoid the pitfall of conviction in any single outcome or prediction. There will likely be some unexpected news that catch many investors off guard and shape the next leg in the market. Those that remain flexible will have the opportunity to make adjustments that leave them in a better position to reduce risk or establish new positions at advantageous prices.
Disclosure: FMD Capital Management, its executives, and/or its clients may hold positions in the ETFs, mutual funds or any investment asset mentioned in this article. The commentary does not constitute individualized investment advice. The opinions offered herein are not personalized recommendations to buy, sell or hold securities.
Trading in financial instruments and/or cryptocurrencies involves high risks including the risk of losing some, or all, of your investment amount, and may not be suitable for all investors. Prices of cryptocurrencies are extremely volatile and may be affected by external factors such as financial, regulatory or political events. Trading on margin increases the financial risks.
Before deciding to trade in financial instrument or cryptocurrencies you should be fully informed of the risks and costs associated with trading the financial markets, carefully consider your investment objectives, level of experience, and risk appetite, and seek professional advice where needed.
Fusion Media would like to remind you that the data contained in this website is not necessarily real-time nor accurate. The data and prices on the website are not necessarily provided by any market or exchange, but may be provided by market makers, and so prices may not be accurate and may differ from the actual price at any given market, meaning prices are indicative and not appropriate for trading purposes. Fusion Media and any provider of the data contained in this website will not accept liability for any loss or damage as a result of your trading, or your reliance on the information contained within this website.
It is prohibited to use, store, reproduce, display, modify, transmit or distribute the data contained in this website without the explicit prior written permission of Fusion Media and/or the data provider. All intellectual property rights are reserved by the providers and/or the exchange providing the data contained in this website.
Fusion Media may be compensated by the advertisers that appear on the website, based on your interaction with the advertisements or advertisers.