The S&P 500 Is Still on Track for 4800. What’s Next?
Dr. Arnout ter Schure | Dec 18, 2023 02:18PM ET
First, let’s take a quick trip down memory lane to understand the current price action better.
- In early August, see here, we warned that per the Elliott Wave Principle (EWP), a significant top could be forming for the S&P500 (SPX). Although the index threw the obligatory and occasional curve ball, by the end of October, it had lost 11%.
- In early October, see here; we already pointed out a rally to $4800 was in the cards.
- The SPX bottomed on October 27 at $4103, and three days prior, see here, we found the Bulls had one last chance to reach $4800, as long as $4100 was not breached because the initial decline from the July $4607 high into the August $4335 low counted best as three waves.
- In mid-November, see here; we followed up on our assessment that the low was most likely in place and that the index could still reach $4800, assuming a standard Fibonacci-based impulse pattern. See Figure 1 below.
- Lastly, in late November, see here, we showed that a local top most likely was brewing, targeting ideally $4520+/-20 before the rally to ideally $4800 would continue. The index bottomed at $4537-46 and now trades at $4740s.
Although we can never get every twist and turn correct, the markets did not adhere to the anticipated larger standard impulse pattern from the October 27 low either. Allow us to explain.
Figure 1. Daily SPX chart with detailed EWP count and technical indicators
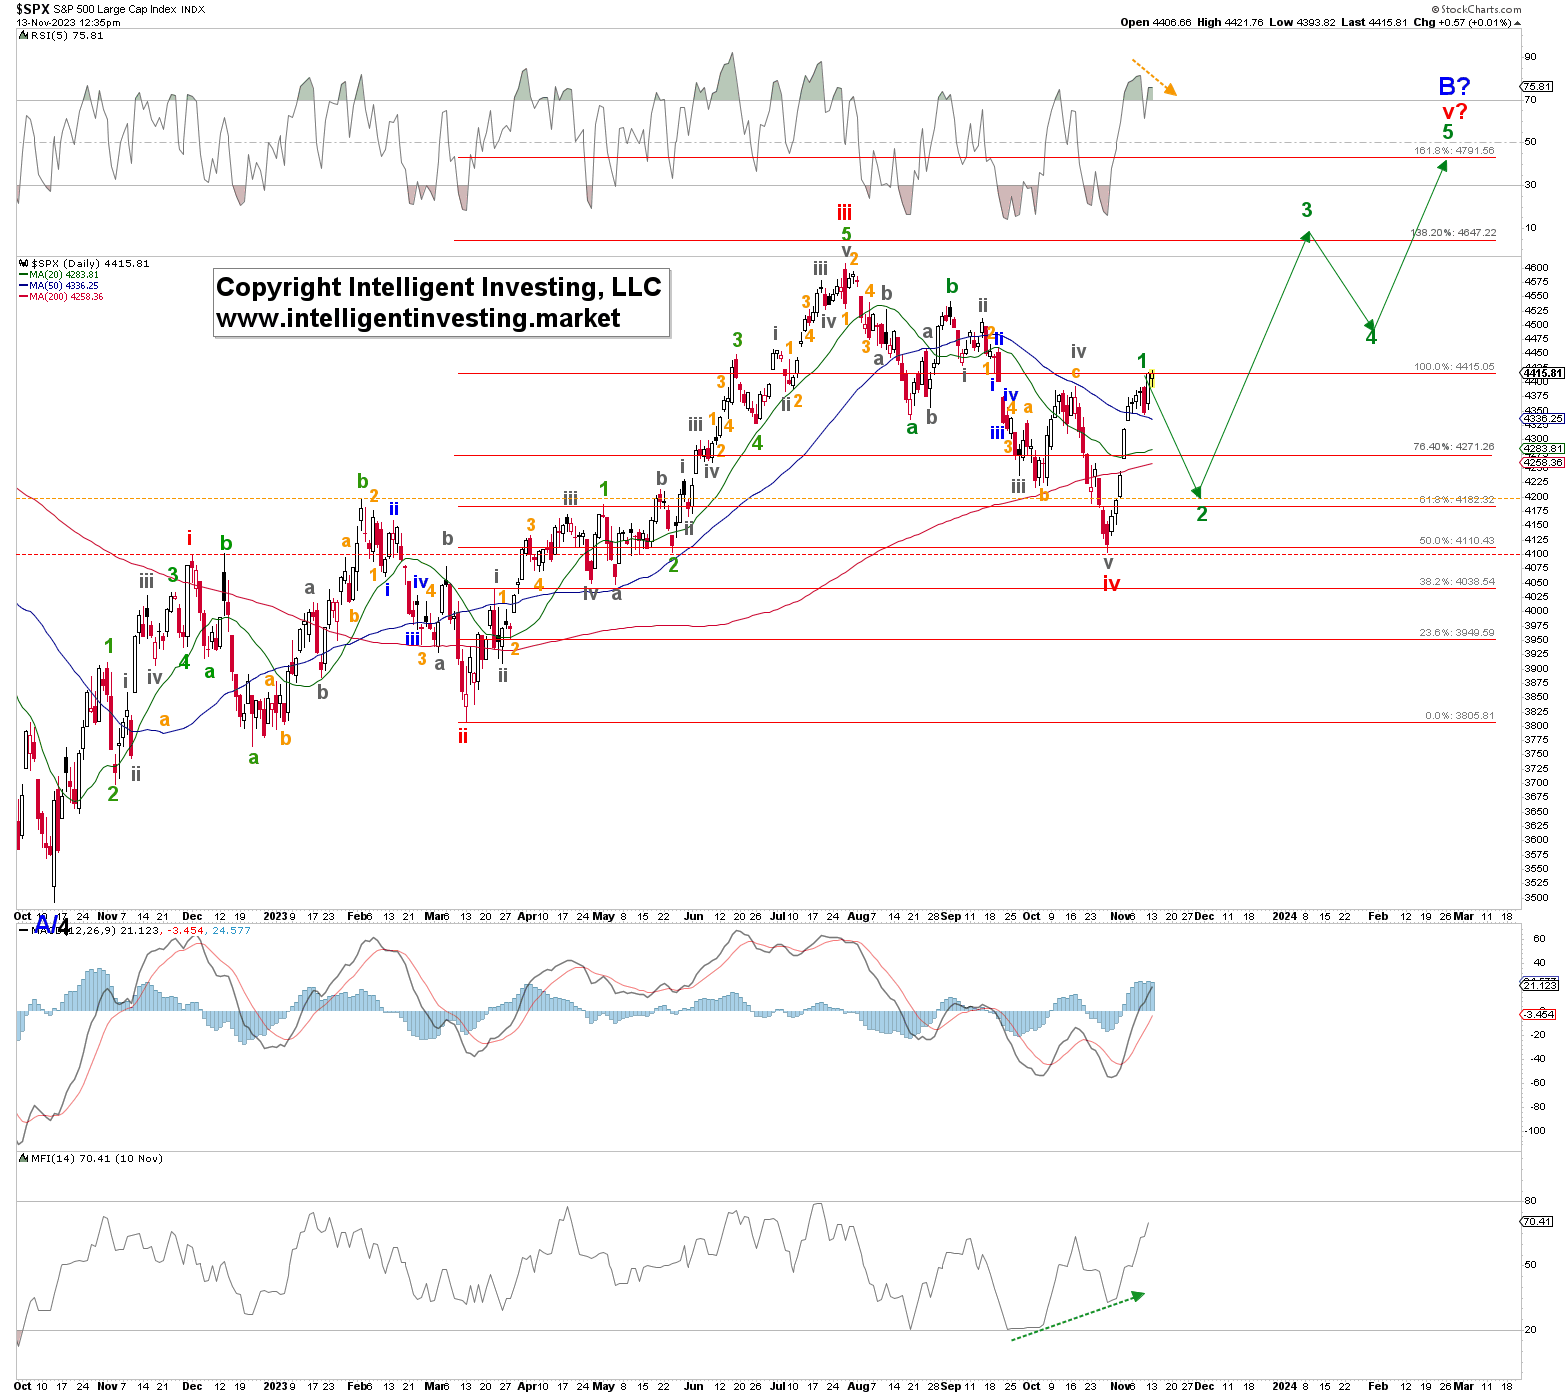
The current S&P 500 move from the recent October low has not even seen a 23.60% retracement. In fact, no “pullback” has exceeded -1.2%. Even the relentless rally off the 2020 low had several ~38.20% retracements and certainly several 23.60% retracements. We do not recall a move of this magnitude that did not have at least a 23.60% pullback. Hence, the current rally is a significant outlier that is unforeseeable when it starts. However, and therefore, it smells of a 5th wave.
Namely, when we track the stock markets, we use objective standards, i.e., the Fibonacci-based impulse pattern, which applies most of the time. But, since the markets do not owe us anything as they say, sometimes the financial markets choose to move outside those standards. Therefore, we cannot foresee all market moves like the one we are currently experiencing. However, just because the Fib-based pattern is not followed doesn’t mean the EWP doesn’t work—quite the contrary. Namely, financial markets are complex systems like the weather and can never always be correctly forecasted. Moreover, the list of our articles above shows we have mostly been right on track. Thus, applying the time-tested objective standards provides appropriate risk management at all times, which is the most critical aspect of trading.
Thus, currently, we are dealing with a price pattern that is truly out of the ordinary for stock markets, which renders the smaller wave structures less clear, but we do have our larger Fib-ratios we can work with. See Figure 2 below.
Figure 2. Daily SPX chart with detailed EWP count and technical indicators
Figure 2 shows that the July high, red W-iii, reached the ideal target zone and (black) 138.20% extension to the T ($4607.07 vs $4606.03). Typical. Usually, the subsequent 4th wave, red W-iv, targets the 76.40% extensions ($4229-71). The index, however, dropped to as low as $4103. Almost the 50% retracements. Atypical. Regardless, for a 5th wave, we can expect either a (red) W-v = W-i = $4712 relationship or a lengthening of the W-v to reach the typical 161.80% extension, which sits at $4749-4795. The latter is more typical, but how we got there is atypical. Namely, as explained, there is no standard Fib-based impulse pattern, which otherwise would have made our lives much more manageable. But who said analyzing (and trading) the stock markets would be easy?
Thus, our primary expectation is for the index to top out, as we forecasted it could almost two months ago, at $4750-4795. Possibly as high as $4802. However, if the index breaks above $4802 on a daily closing basis, we will look for the index to reach the next Fib-extension target zone: 176.40% at $4838-83. The first warning for the Bulls is a break and daily close below $4694, the 2nd warning is below $4643, and the 3rd warning is below $4606. The rally from the October low will have ended on a break below $4545. When that happens, we will look for the index to
- Either have put in a long-term top (blue W-B) and set course for the mid-$2000s or
- Present us with “only” a drop to ideally around $4373-4418 for the black W-4?, before a final rally to as high as $4982-5026 for the black W-5?.
Hence, at this point, it would be appropriate to assess the short- to long-term risk/reward at current price levels, and the warning levels above can be used as one’s insurance policy to prevent havoc on one’s portfolio.
Trading in financial instruments and/or cryptocurrencies involves high risks including the risk of losing some, or all, of your investment amount, and may not be suitable for all investors. Prices of cryptocurrencies are extremely volatile and may be affected by external factors such as financial, regulatory or political events. Trading on margin increases the financial risks.
Before deciding to trade in financial instrument or cryptocurrencies you should be fully informed of the risks and costs associated with trading the financial markets, carefully consider your investment objectives, level of experience, and risk appetite, and seek professional advice where needed.
Fusion Media would like to remind you that the data contained in this website is not necessarily real-time nor accurate. The data and prices on the website are not necessarily provided by any market or exchange, but may be provided by market makers, and so prices may not be accurate and may differ from the actual price at any given market, meaning prices are indicative and not appropriate for trading purposes. Fusion Media and any provider of the data contained in this website will not accept liability for any loss or damage as a result of your trading, or your reliance on the information contained within this website.
It is prohibited to use, store, reproduce, display, modify, transmit or distribute the data contained in this website without the explicit prior written permission of Fusion Media and/or the data provider. All intellectual property rights are reserved by the providers and/or the exchange providing the data contained in this website.
Fusion Media may be compensated by the advertisers that appear on the website, based on your interaction with the advertisements or advertisers.