The Silver Megathrust
Stephan Bogner | Apr 27, 2012 12:20AM ET
."-- Mark Twain
Between 1970 and 1979, the silver price was increasing steadily from $1.50 to $6, before taking off in September 1979 from $10 to $50 within 5 months. During that bull cycle, demand for silver did not increase but actually declined (sharply in 1979).
It was as late as 1983 when demand increased confidently from 12,000 to 27,000 tons per year until 2000 – yet the silver price was in a 20 year bear market during that time. In 2003, when silver started its new bull market, the demand actually dropped to 23,000 tons until 2005 – during which 2 years silver almost doubled from $4.50 to $8.
Since 2005, demand is rising stronger than ever, having reached 33,000 tons in 2010, whereas the silver price is rising strongly as well.
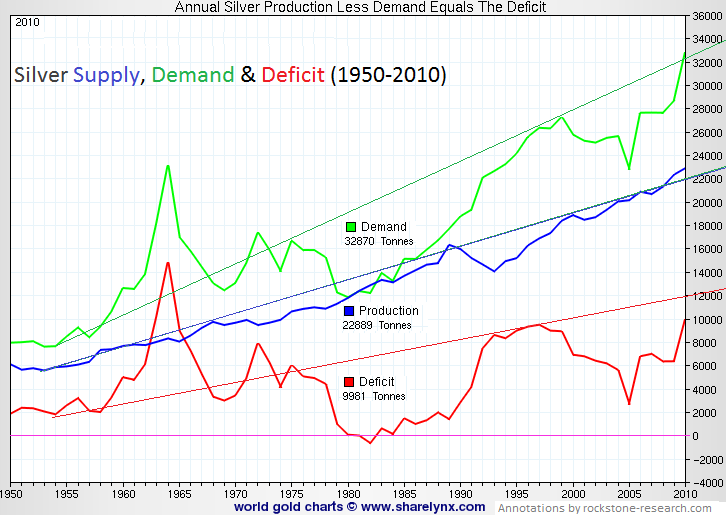
The initial comparisons indicate one important phenomenon in the silver market, namely that (industrial) silver demand is “price inelastic”: that is, changes in price have a relatively small effect on the quantity demanded.
The demand for other commodities is known to be “price elastic”: that is, changes in price have a relatively large effect on the quantity demanded (if tomato prices blow up, go bananas). This basically translates into: no matter if the silver price crashes or explodes, demand – unimpressed – will keep its own dynamic pace, because demand does not respond to price changes.
First, silver is the most broadly used metal, because of its unique characteristics, such as highest thermal and electrical conductivity of all metals. In most of its few thousand application fields, silver is considered a non-substitutable product. In contrast for example, when the platinum price increases too strongly, automotive demand traditionally substitutes for cheaper palladium thus potentially driving down the platinum price. Secondly, silver typically makes up only a relatively small component in the total of the product and the total of its costs. Both these demand characteristics/inelasticities (not substitutable and small cost component) are crucial to understand the silver price, because they remind that no matter if price explodes or crashes, (industrial) demand virtually does not care, but keeps on consuming as per its own factors/fundamentals.
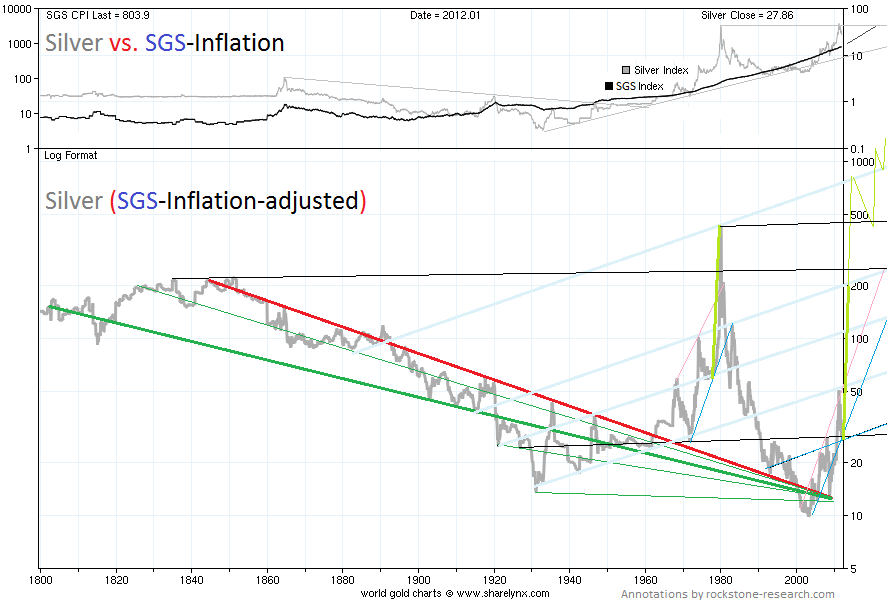
Notwithstanding, an increased demand principally has a positive effect on the price, of course (Shadow Government Statistics ) index is felt to better reflect real inflation, whereas it uses the same definition/calculation of inflation as official government agencies used in 1980. Currently, the annual SGS inflation rate stands at 6% p.A. If we now adjust the dollar by SGS-inflation (instead of CPI) and look back at “the old all-time high” of the last bull cycle in January 1980, we note the “SGS real” silver price traded at almost $500 (in today’s dollar terms, whereas these terms are defined by an inflation measure that was used in 1980 and not today). This translates into: if I wanted to sell silver today at the same price level as in January 1980 considering todays purchasing power of the dollar, silver would need to trade at around $500 today. Or the other way around: if I bought silver at the peak of the last bull market, its price must really/today trade at around $500 to get me out without a real/net loss.
Trading in financial instruments and/or cryptocurrencies involves high risks including the risk of losing some, or all, of your investment amount, and may not be suitable for all investors. Prices of cryptocurrencies are extremely volatile and may be affected by external factors such as financial, regulatory or political events. Trading on margin increases the financial risks.
Before deciding to trade in financial instrument or cryptocurrencies you should be fully informed of the risks and costs associated with trading the financial markets, carefully consider your investment objectives, level of experience, and risk appetite, and seek professional advice where needed.
Fusion Media would like to remind you that the data contained in this website is not necessarily real-time nor accurate. The data and prices on the website are not necessarily provided by any market or exchange, but may be provided by market makers, and so prices may not be accurate and may differ from the actual price at any given market, meaning prices are indicative and not appropriate for trading purposes. Fusion Media and any provider of the data contained in this website will not accept liability for any loss or damage as a result of your trading, or your reliance on the information contained within this website.
It is prohibited to use, store, reproduce, display, modify, transmit or distribute the data contained in this website without the explicit prior written permission of Fusion Media and/or the data provider. All intellectual property rights are reserved by the providers and/or the exchange providing the data contained in this website.
Fusion Media may be compensated by the advertisers that appear on the website, based on your interaction with the advertisements or advertisers.