The Power Of The Triangle
Wall Street Daily | Feb 08, 2016 12:50AM ET
Last week, we talked about support and resistance – both of which drive the technical study of the financial markets.
Let’s expand on this theory by introducing another key technical idea, one that applies to far more than just investing.
That is, the fact that history repeats itself.
For example: Whether you believe in seasonality or not, January’s stock performance mirrored that of the last 10 years.
Since 2006, the Dow Jones Industrial Average (DJIA) has logged an average decline of 2.3% in January. Over the first month of 2016, the DJIA declined 4%. The prevailing monthly downtrend has held.
From intraday peak to trough, the DJIA plummeted even more – 13%. But the DJIA rallied sharply off the mid-month lows and tested its overhead 20-day moving average (DMA).
Now, a familiar bullish pattern is showing up on stock charts across the entire market. Today, I’m going to show you how to read it and trade it like a pro.
The Triangle Offense
One of the chart patterns you should always watch for following a steep selloff is the ascending triangle.
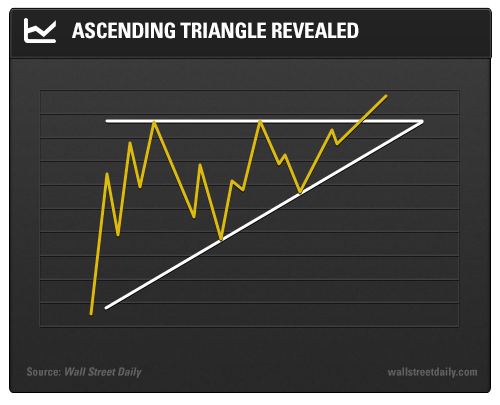
The ascending triangle pattern forms as the support line for a stock rises and shares meet overhead resistance at the same time. This chart pattern tells us that demand for shares in a company is rising – a bullish sign by any measure.
So, what does this chart pattern have to do with selloffs?
When share prices reverse a previous downtrend, they usually test recent highs as buyers return. A trader who wants to take a long position in such a stock need only wait for shares to “break out” above the resistance.
More aggressive traders who are confident in the trend will often take their positions ahead of the break. These traders buy when shares retrace to the support line after a failed test of resistance.
Either way, if the resistance becomes support, shares will likely enjoy a nice run up the chart as new buyers rush in.
Let’s take a look at a company that’s showing this pattern right now.
A Golden Opportunity
Agnico Eagle Mines Limited (TO:AEM) is a Canadian gold mining company founded in 1957 and headquartered in Toronto. The company operates nine mines across Canada, Mexico, and Finland.
From peak to trough, shares have fallen 76% since hitting their all-time high in 2011. But after bottoming out last August, shares have broken their long-term downtrend and stormed up the chart. In fact, share prices are up 18% year to date versus a 5% decline in the broader market.
Of course, gold prices – as well as mining stocks – are now on the rise as the Federal Reserve will likely delay further interest rate hikes on weak economic data.
As you can see, following Agnico Eagle’s fall from May to August, shares rallied and tested previous support around $30.23. And since September, the support line has trended upward, creating a triangle.
An aggressive long trader could have traded this pattern by taking a new position in December when shares retraced to the support line.
But shares have just broken through the resistance – which has now become support. All traders can now take new positions with confidence and ride the shares upward.
The key to confirming a break above the resistance line is increased volume. If the breakout occurs on light volume, it could be a false signal and a sign of some coming downside. However, if shares break out on heavy volume, the potential for greater upside is high.
In this case, shares broke out on above-average volume and closed up 5% on the day of the break. As such, Agnico Eagle provides the perfect opportunity to cash in on gold’s resurgence right now.
On the hunt,
Original post
Trading in financial instruments and/or cryptocurrencies involves high risks including the risk of losing some, or all, of your investment amount, and may not be suitable for all investors. Prices of cryptocurrencies are extremely volatile and may be affected by external factors such as financial, regulatory or political events. Trading on margin increases the financial risks.
Before deciding to trade in financial instrument or cryptocurrencies you should be fully informed of the risks and costs associated with trading the financial markets, carefully consider your investment objectives, level of experience, and risk appetite, and seek professional advice where needed.
Fusion Media would like to remind you that the data contained in this website is not necessarily real-time nor accurate. The data and prices on the website are not necessarily provided by any market or exchange, but may be provided by market makers, and so prices may not be accurate and may differ from the actual price at any given market, meaning prices are indicative and not appropriate for trading purposes. Fusion Media and any provider of the data contained in this website will not accept liability for any loss or damage as a result of your trading, or your reliance on the information contained within this website.
It is prohibited to use, store, reproduce, display, modify, transmit or distribute the data contained in this website without the explicit prior written permission of Fusion Media and/or the data provider. All intellectual property rights are reserved by the providers and/or the exchange providing the data contained in this website.
Fusion Media may be compensated by the advertisers that appear on the website, based on your interaction with the advertisements or advertisers.