The Philly Fed ADS Business Conditions Index
Doug Short | Dec 27, 2012 12:00PM ET
The Philly Fed's Aruoba-Diebold-Scotti Business Conditions Index (hereafter the ADS index) is a fascinating but little known real-time indicator of business conditions for the U.S. economy, not just the Third Federal Reserve District, which covers eastern Pennsylvania, southern New Jersey, and Delaware. Thus it is comparable to the better-known Chicago Fed's National Activity Index, which is updated monthly (more about the comparison below).
Named for the three economists who devised it, the index, as described on its home page, is designed to track real business conditions at high frequency.
It's Based On Six Underlying Data Series:
- Weekly initial jobless claims
- Monthly payroll employment
- Industrial production
- Personal income less transfer payments
- Manufacturing and trade sales
- Quarterly real GDP
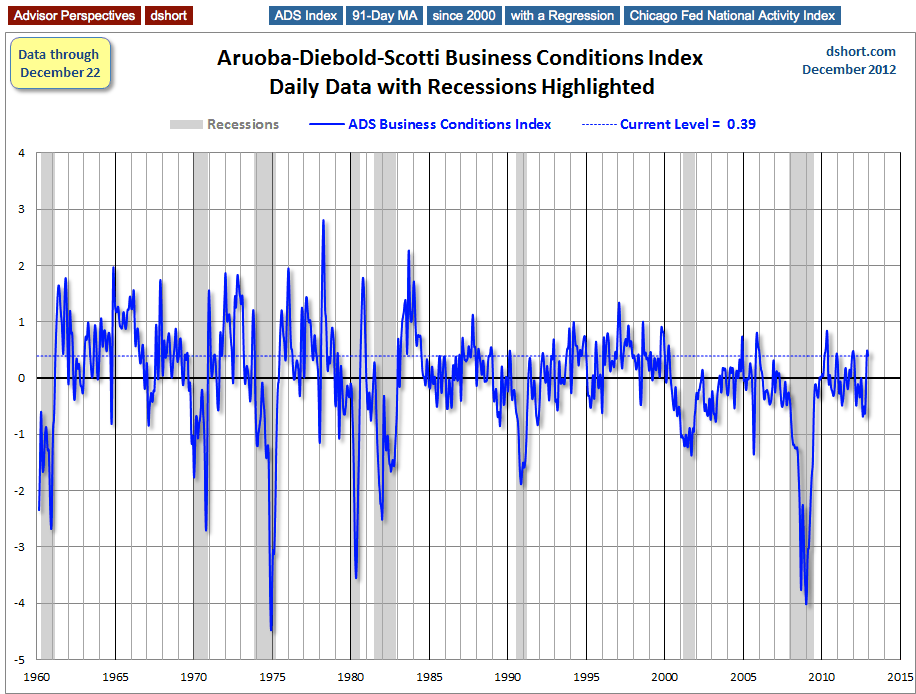
The accompanying commentary goes on to explain that The average value of the ADS index is zero. Progressively bigger positive values indicate progressively better-than-average conditions, whereas progressively more negative values indicate progressively worse-than-average conditions.
The first chart shows the complete data series, which stretches back to 1960. I've highlighted recessions and the current level of this daily index through its latest data point.
To facilitate comparison with the Chicago Fed's National Activity Index (CFNAI), I've created a 91-day moving average of this daily index. Why 91 days? The CFNAI is updated monthly, but the metric that gets the most attention by the Chicago Fed economists is its three-month moving average. They've even coined an acronym for it, the CFNAI-MA3. Thus I've used 91 days as a comparable smoothing of the Philly Fed ADS index. In the ADS 91-day MMA chart below I've highlighted recessions and the value of the smoothed index at recession starts.
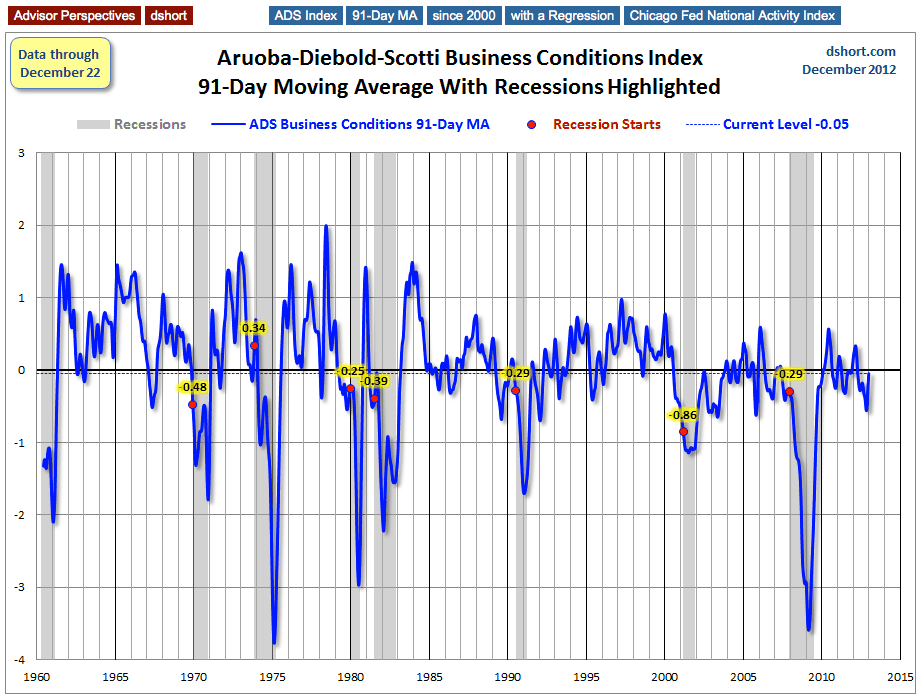
As we can readily see, the current level of this index is higher than it was at the onset of all recessions with the exception of the one in 1973-1975 that was triggered by the Arab Oil Embargo and subsequent gasoline shortages.
Now let's compare the Philly Fed's Business Conditions Index with the Chicago Fed's National Activity Index (CFNAI), which reaches back to March 1967. (See also my latest monthly update for the CFNAI monthly update .Here is the afore-mentioned CFNAI-MA3.
Even the most cursory examination shows the close correlation of these two indicators of the general economy. Moreover, the recession overlays for both also confirm their general accuracy in real-time calls on major economic downturns over the last few decades.
The next chart reveals a trend in the ADS index -- one that might not be obvious at first glance. Let's let Excel draw linear regressions through the data series.
Compare the slope of the regression with its counterpart in the CFNAI-MA3.
This chart duo indeed tells us something about the long-term trend toward slowing growth in post-industrial economy of the United States.
Trading in financial instruments and/or cryptocurrencies involves high risks including the risk of losing some, or all, of your investment amount, and may not be suitable for all investors. Prices of cryptocurrencies are extremely volatile and may be affected by external factors such as financial, regulatory or political events. Trading on margin increases the financial risks.
Before deciding to trade in financial instrument or cryptocurrencies you should be fully informed of the risks and costs associated with trading the financial markets, carefully consider your investment objectives, level of experience, and risk appetite, and seek professional advice where needed.
Fusion Media would like to remind you that the data contained in this website is not necessarily real-time nor accurate. The data and prices on the website are not necessarily provided by any market or exchange, but may be provided by market makers, and so prices may not be accurate and may differ from the actual price at any given market, meaning prices are indicative and not appropriate for trading purposes. Fusion Media and any provider of the data contained in this website will not accept liability for any loss or damage as a result of your trading, or your reliance on the information contained within this website.
It is prohibited to use, store, reproduce, display, modify, transmit or distribute the data contained in this website without the explicit prior written permission of Fusion Media and/or the data provider. All intellectual property rights are reserved by the providers and/or the exchange providing the data contained in this website.
Fusion Media may be compensated by the advertisers that appear on the website, based on your interaction with the advertisements or advertisers.