Bearish Signal From 3-Month Treasury Yield
Troy Bombardia | May 24, 2019 09:00PM ET
The Dow fell for five consecutive weeks, and markets that are more impacted by the trade war have been impacted more. Here’s the return for various markets since the trade war began on January 22, 2018.
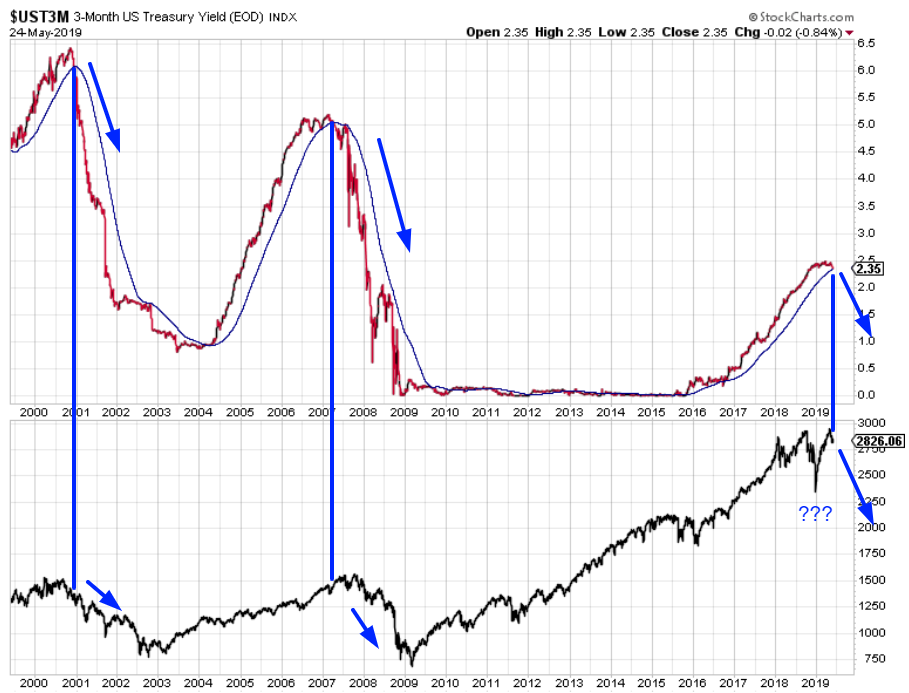
Treasury yields
The 3-Month Treasury yield is about to fall below its 200-day moving average (possibly next Tuesday or Wednesday). Many traders are wary of this because the Fed tends to cut interest rates just before a recession and bear market begins.
And if we just look at the past 20 years, this does appear to be a bearish sign.
But to avoid recency bias, let’s look at all the historical cases in which the 3 month Treasury yield fell below its 200 DMA, while Unemployment is less than 6% (late-cycle cases).
This is a slightly short term bearish for the S&P, and mostly bullish 3 months later.
Here’s what happens next to the 3 month Treasury yield.
Dow’s losing streak
The Dow fell 5 weeks in a row, which is quite the persistent decline. This is rare when the stock market remains in a long term uptrend and is so close to all-time highs.
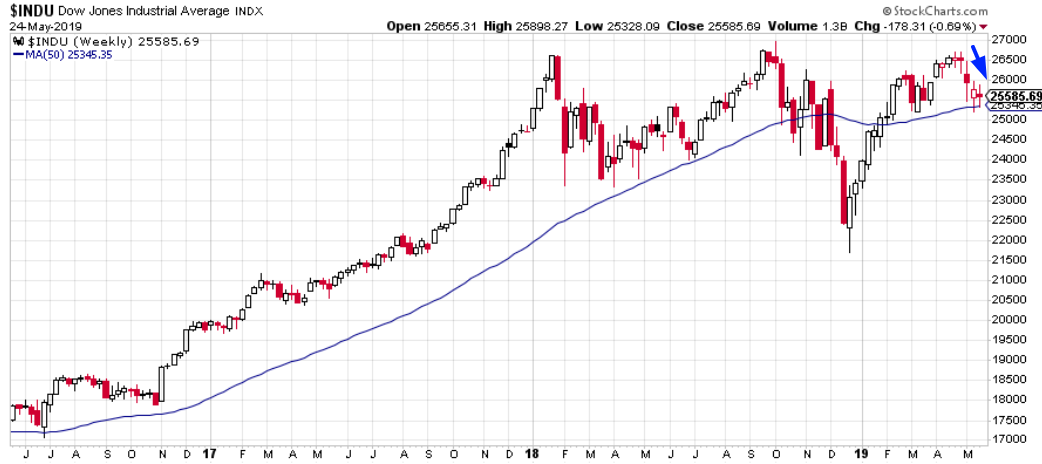
Here’s what happens next to the Dow when it falls 5 weeks in a row.
But what if we isolate for the cases in which the Dow was above its 50-week moving average?
Surprisingly, this is mostly bearish for the Dow. It’s also worth noting that most of the bearish cases happened before 1950. Historical data before 1950 is skewed because dividend yields pre-1950 were much lower than dividend yields post-1950.
Volatility fade
VIX and the S&P have fallen together over the past 2 weeks. This is quite rare because VIX and the S&P tend to move in different directions.
This is mostly bullish for the S&P 3 months later.
And mostly bearish for VIX.
The SKEW Index measures financial risk. It tends to move in line with the S&P because:
- As the stock market rises, the probability of a decline/crash increases.
- As the stock market falls, the probability of a further decline/crash decreases.
SKEW and the S&P have diverged significantly over the past 4 months.
Here’s what happens next to the S&P when SKEW falls more than -10% over the past 4 months while the S&P rises more than 5%.
Once again, mostly bullish 3 months later.
Risk on, risk off
The stock market is exhibiting a clear risk-on, the risk-off environment in which defensive stocks move inversely with the S&P.
8 of the past 10 days have seen XLU (utilities – defensive sector) and the S&P move in opposite directions.
Here’s what happens next to the S&P when XLU and the S&P move in different directions for at least 8 of the past 10 days.
The sample size is small, so let’s relax the parameters to increase the sample size.
Here’s what happens next to XLU:
This is slightly more bearish for XLU than the S&P over the next month,
Semiconductors
Sectors that are extremely tied to trade have significantly underperformed over the past few weeks. Here’s the Semiconductor Index, which has crashed.
Here’s the Semiconductor Index’s 3-week rate-of-change, which is now on par with 2008!
Is this a short term bullish contrarian sign?
Here’s what happens next to the Semiconductor Index when it falls more than -15% over the past 3 weeks.
Mostly bearish over the next 1 week.
Here’s what happens next to the S&P.
XLE
XLE (NYSE:XLE) (energy sector ETF) is now down 7 weeks in a row.
From 1998 – present, this has only happened 1 other time: June 2015.
Conclusion
Here is our discretionary market outlook:
- The U.S. stock market’s long term risk: reward is not bullish. In a most optimistic scenario, the bull market probably has 1 year left.
- Most of the medium term market studies (e.g. next 6-12 months) are bullish.
- The short term (e.g. next 1-3 months) is very noisy right now. There is no clear risk: reward edge in either direction. Some short term market studies are bullish, and others are bearish.
Goldman Sachs’ Bull/Bear Indicator demonstrates that risk: reward does favor long term bears.
Trading in financial instruments and/or cryptocurrencies involves high risks including the risk of losing some, or all, of your investment amount, and may not be suitable for all investors. Prices of cryptocurrencies are extremely volatile and may be affected by external factors such as financial, regulatory or political events. Trading on margin increases the financial risks.
Before deciding to trade in financial instrument or cryptocurrencies you should be fully informed of the risks and costs associated with trading the financial markets, carefully consider your investment objectives, level of experience, and risk appetite, and seek professional advice where needed.
Fusion Media would like to remind you that the data contained in this website is not necessarily real-time nor accurate. The data and prices on the website are not necessarily provided by any market or exchange, but may be provided by market makers, and so prices may not be accurate and may differ from the actual price at any given market, meaning prices are indicative and not appropriate for trading purposes. Fusion Media and any provider of the data contained in this website will not accept liability for any loss or damage as a result of your trading, or your reliance on the information contained within this website.
It is prohibited to use, store, reproduce, display, modify, transmit or distribute the data contained in this website without the explicit prior written permission of Fusion Media and/or the data provider. All intellectual property rights are reserved by the providers and/or the exchange providing the data contained in this website.
Fusion Media may be compensated by the advertisers that appear on the website, based on your interaction with the advertisements or advertisers.