Hang Seng Index: Larger Bullish Cycles
Elliott Wave Forecast | May 23, 2018 11:09AM ET
Firstly the Hang Seng index larger bullish cycles have been trending higher with other world indices. In April 2003 it put in a huge degree pullback low. From there the index rallied with other world indices again until October 2007. It then corrected the rally as did most other world stock indices. It ended this larger degree correction in October 2008. From those 2008 lows, the index shows a 5 swing sequence that favors further upside. Price has reached and exceeded the area of 29410 – 32040 which is the .618 – .764 Fibonacci extension of the 2008 to 2015 cycle.
The way this is measured is as follows. Use a Fibonacci extension tool on a charting platform. Point 1 will be at the beginning of the cycle at the 2008 lows. From there on up to the 2015 highs will be point 2. The point 3 will be down at the 2016 lows. As previously mentioned, the index in January 2018 saw the .618 – .764 Fibonacci extension of the 2008 to 2015 cycle. In most cases a fifth swing will end in this Fibonacci extension area however this index has been a bit more bullish. Analysis continues below the chart.
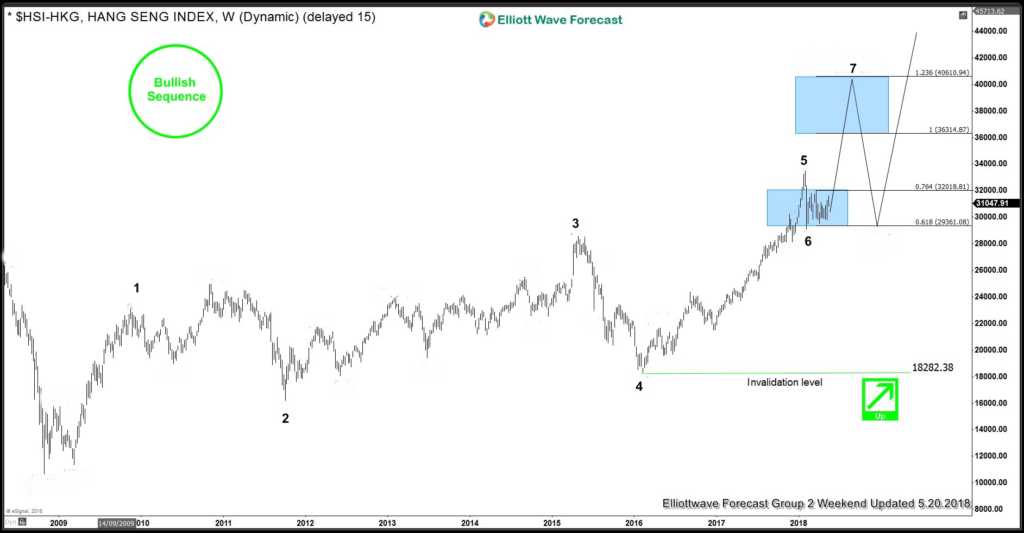
In conclusion. Currently the Hang Seng pullback from the 5th swing high ended the cycle up from the 2016 lows. It did a 3 swing pullback to the February 2018 lows to complete the 6th swing. At this point it is favored to remain above there during dips. Worst case if it remains below the January 2018 highs it can continue a pullback in the 6th swing in 3 more swings. This would make a possible 7, or 11 swings to correct the cycle up from the 2016 low which should be similar to the 2nd swing pullback of 2011. Afterward of completion of the 6th swing pullback it should see more upside in the 7th swing toward 36314.

Trading in financial instruments and/or cryptocurrencies involves high risks including the risk of losing some, or all, of your investment amount, and may not be suitable for all investors. Prices of cryptocurrencies are extremely volatile and may be affected by external factors such as financial, regulatory or political events. Trading on margin increases the financial risks.
Before deciding to trade in financial instrument or cryptocurrencies you should be fully informed of the risks and costs associated with trading the financial markets, carefully consider your investment objectives, level of experience, and risk appetite, and seek professional advice where needed.
Fusion Media would like to remind you that the data contained in this website is not necessarily real-time nor accurate. The data and prices on the website are not necessarily provided by any market or exchange, but may be provided by market makers, and so prices may not be accurate and may differ from the actual price at any given market, meaning prices are indicative and not appropriate for trading purposes. Fusion Media and any provider of the data contained in this website will not accept liability for any loss or damage as a result of your trading, or your reliance on the information contained within this website.
It is prohibited to use, store, reproduce, display, modify, transmit or distribute the data contained in this website without the explicit prior written permission of Fusion Media and/or the data provider. All intellectual property rights are reserved by the providers and/or the exchange providing the data contained in this website.
Fusion Media may be compensated by the advertisers that appear on the website, based on your interaction with the advertisements or advertisers.