The Gold-Stock Correction And What's Ahead
Gary Tanashian | Oct 18, 2019 06:31PM ET


What’s In Play Now
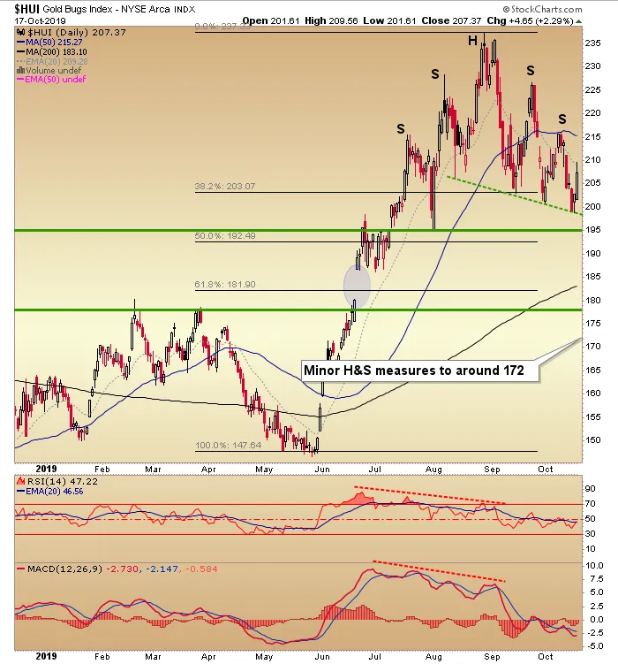
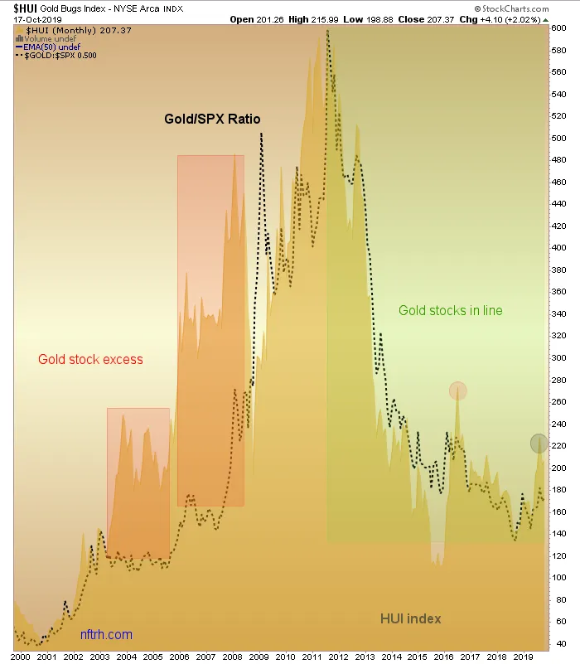
It has been about 2 months since the gold-stock sector, as represented by the HUI index, topped out. The ensuing correction has been a whipsaw affair of ups and downs, but smoothing that volatility out we find an ongoing correction in time and price that has not been too difficult to manage.The pattern that some would call a “complex H&S” (TA-speak for a freakish pattern with too many shoulders) held a key lower high on the recent bounce to the daily chart’s SMA 50 (blue line). The neckline has been tested (and held) twice since it was created in September and the negative RSI divergence that began last summer has been guiding Huey downward.It’s all normal and by the chart above you can see the targets, which have been 195 (minor support) and better support at the convergence of a lot of markers, including major breakout support and a gap at 180, the rising SMA 200 (183), a 62% Fib retrace (182) and finally, the pattern’s measurement at around 172. That’s a lot of technical traffic pointing to the 170s-180s for the correction’s ultimate goal, which is to wash out the excess.And excess there sure was, as we noted well ahead of time in NFTRH using this chart showing how far HUI got ahead of what I consider the most important macro fundamental indicator for the sector, gold vs. stocks and in particular, gold vs. the US S&P 500.But a correction is not to be feared. In the gold stock sector especially, it is to be anticipated, worked with and even appreciated as the furious momentum gets addressed and is slowly turned toward a dull despair after weeks and months of grind. The chart above makes the point that HUI got as far ahead of itself (with respect to gold/SPX) as it did at the fatal 2016 top (red dot).Yes it did that, but I don’t expect this situation to be fatal. Not in the least. Below, we can add another support marker to the TA traffic as the monthly EMA 20 (173) has flattened out and is starting to turn up. It was a key limiter in the preceding bear market as well as during the post-2016 consolidation/correction.
What Lays Ahead
On the bigger picture the best target for this rally that I am willing to put out there (until the macro shows its cards) is in the upper 300s, which even as an upward A-B-C bear market correction would be about a 100% increase in the index from the current shorter-term downward correction’s objectives. And for many of the miners and explorers we track and update each week the gains would be much higher (in some cases they already were on the rally leg that began in May).
If we move into an inflationary phase, USD could weaken substantially. In NFTRH we are currently using the 2003-2008 playbook as a 2020-forward guide due to factors beyond the scope of this article. In that historical time frame the HUI index rose some 250% before its bloated over-valuation was rightly addressed in H2 2008. So the good news is that gold stocks can go a long way as valuations bloat and fundamentals degrade.
And the fundamentals did degrade into that justified 2008 top. If the view is correct that rising long-term yields, a steepening yield curve and cyclical inflation issues are going to bubble to the surface of US and global markets in 2020 the ‘C’ objective on the chart above would be very doable. But as I’ve harped upon repeatedly, gold stocks would then be just another passenger on the inflation train. If it’s a runaway train, beaten down resource and commodity producers and regions will participate. The inflation/reflation trade would fan out and as gold under performs cyclical commodities the investment case in the miners would weaken.
If on the other hand the US dollar and Japanese yen strengthen again, along with long-term Treasury bonds and and risk goes off and deflation regains its footing, the gold stock fundamental backdrop would remain excellent as was the case last summer. If a chronic deflationary backdrop were to gain the upper hand… then we’d talk about a longer-term gold stock bull.
The bottom line is that while a majority of gold bugs also seem to be inflation bugs, if a global inflation/reflation trade comes about the gold miners are likely to participate and spit out good profits. But at some point players should tune out the cheer leading sure to come in the tradition of the 2003-2008 phase, that pumps unsuspecting and less experienced players with hair-brained theory like last decade’s “oil is going up, driving inflation up, driving gold up… buy gold stocks!”
That stuff actually was promoted and bought in and around 2007. Never mind that oil is a prime cost driver of gold mining operations. Why let reality get in the way of a good story? Let’s keep in mind that this cartoon illustrates the best backdrop for gold stock sector and macro fundamentals. But let’s also keep in mind that some of the best gains for gold stocks can come not as the fundamentals are at their best, but as they degrade. So bring it on, inflation or deflation, but have the proper game plan for whichever backdrop plays out.
Trading in financial instruments and/or cryptocurrencies involves high risks including the risk of losing some, or all, of your investment amount, and may not be suitable for all investors. Prices of cryptocurrencies are extremely volatile and may be affected by external factors such as financial, regulatory or political events. Trading on margin increases the financial risks.
Before deciding to trade in financial instrument or cryptocurrencies you should be fully informed of the risks and costs associated with trading the financial markets, carefully consider your investment objectives, level of experience, and risk appetite, and seek professional advice where needed.
Fusion Media would like to remind you that the data contained in this website is not necessarily real-time nor accurate. The data and prices on the website are not necessarily provided by any market or exchange, but may be provided by market makers, and so prices may not be accurate and may differ from the actual price at any given market, meaning prices are indicative and not appropriate for trading purposes. Fusion Media and any provider of the data contained in this website will not accept liability for any loss or damage as a result of your trading, or your reliance on the information contained within this website.
It is prohibited to use, store, reproduce, display, modify, transmit or distribute the data contained in this website without the explicit prior written permission of Fusion Media and/or the data provider. All intellectual property rights are reserved by the providers and/or the exchange providing the data contained in this website.
Fusion Media may be compensated by the advertisers that appear on the website, based on your interaction with the advertisements or advertisers.