The Four Elements Thematic ETF Portfolio
Tony Dong | Dec 20, 2024 11:41AM ET
You’ve probably heard of thematic ETFs—funds that target specific trends, ideas, or industries instead of sticking to broad market or sector exposure.
There’s a wide range of quality in this space. Some thematic ETFs are genuinely solid, like the Global X US Infrastructure Development ETF (ASX:PAVE) and the Global X Defense Tech ETF (NYSE:SHLD). These funds focus on long-term themes with real tailwinds behind them.
With a 0.60% net expense ratio, the fund’s top holdings primarily come from the U.S., Denmark, Canada, and Germany, with most being utilities—making FAN relatively rate-sensitive.
The earth component
This one was the easiest—just use a mining ETF. The SPDR S&P Metals & Mining ETF (NYSE:XME) does the job well. XME is one of the better-capitalized funds on this list, with $1.7 billion in AUM, and it’s also more affordable, with a 0.35% expense ratio.
The ETF tracks the S&P Metals & Mining Select Industry Index, an equal-weighted benchmark that includes equities in aluminum, coal & consumable fuels, copper, diversified metals & mining, gold, precious metals & minerals, silver, and steel from the S&P Total (EPA:TTEF) Market Index.
Because it’s equal-weighted, top holdings will always reflect whichever companies have outperformed between rebalances, so there’s no point in analyzing specific holdings here.
Putting the portfolio together
A portfolio of 25% each in TAN, PHO, FAN, and XME would have returned an annualized 2.24% from June 27, 2008, to December 13, 2024. For context, the S&P 500 delivered a much stronger 12.00% over the same period.
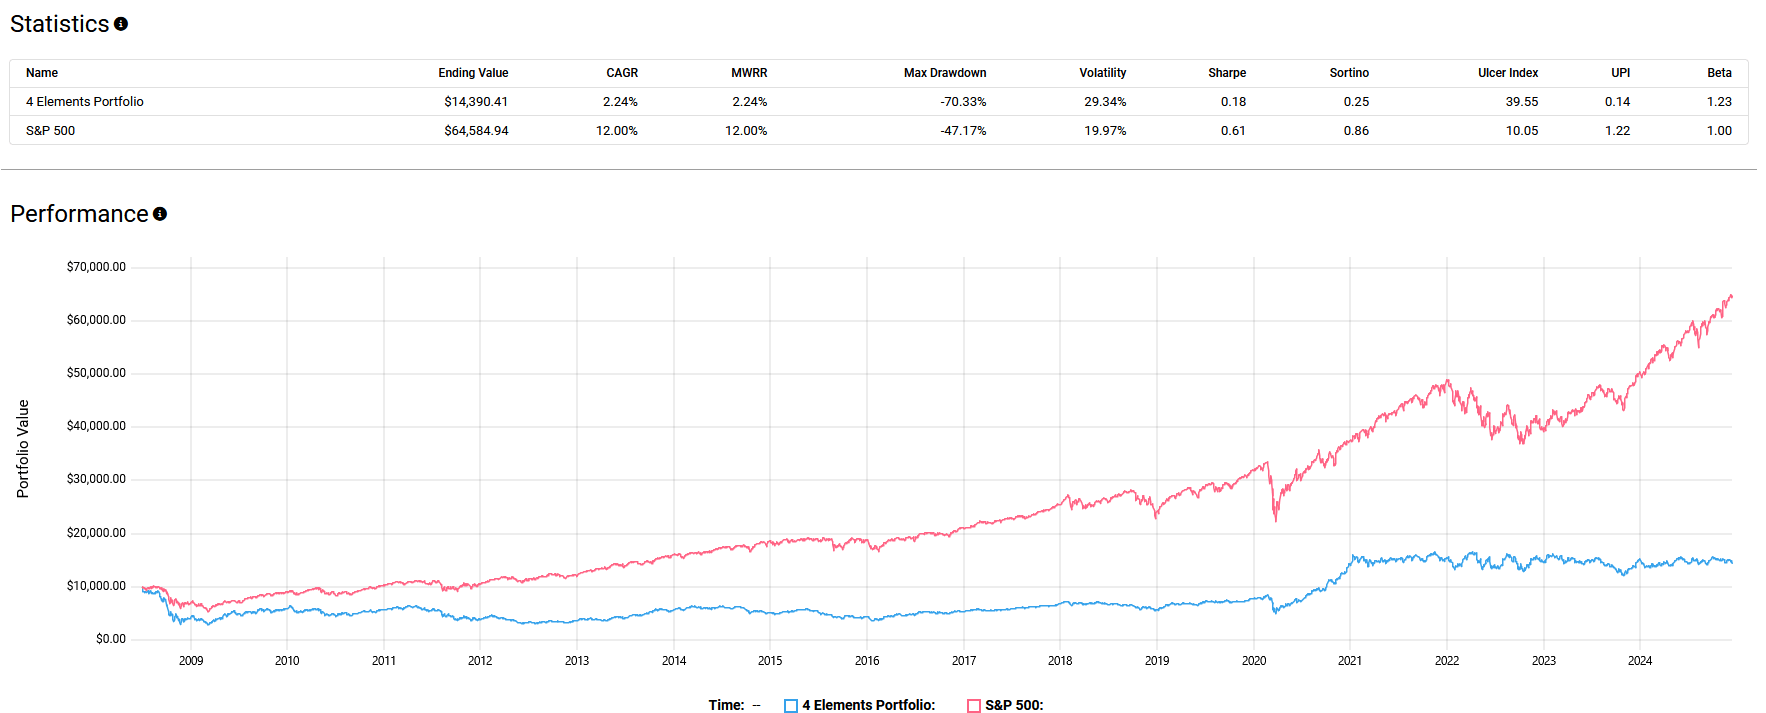
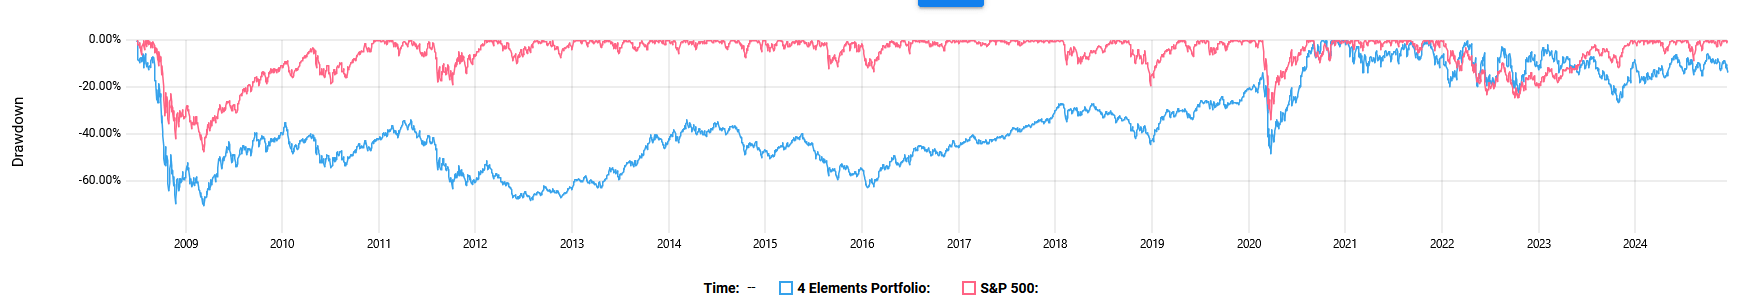
It’s not just about returns, though. The Four Elements Portfolio had terrible risk metrics, with a standard deviation of 29.34% and a max drawdown of -70.33%. Compare that to the S&P 500, which had a standard deviation of 19.97% and a max drawdown of -47.17%.
Unsurprisingly, the risk-adjusted returns tell the same story: a Sharpe ratio of 0.18 for the Four Elements Portfolio versus 0.61 for the S&P 500.
The blatantly obvious lesson here? Don’t throw ETF portfolios together haphazardly! Yes, this one was silly, but I’ve honestly seen similar—or worse—ideas floating around Reddit.
Disclaimer: The information provided by ETF Portfolio Blueprint is for general informational purposes only. All information on the site is provided in good faith, however, we make no representation or warranty of any kind, express or implied, regarding the accuracy, adequacy, validity, reliability, availability, or completeness of any information on the site. Past performance is not indicative of future results. ETF Portfolio Blueprint does not offer investment advice, and readers are encouraged to do their own research (DYOR) before making any investment decisions.
![]()
Trading in financial instruments and/or cryptocurrencies involves high risks including the risk of losing some, or all, of your investment amount, and may not be suitable for all investors. Prices of cryptocurrencies are extremely volatile and may be affected by external factors such as financial, regulatory or political events. Trading on margin increases the financial risks.
Before deciding to trade in financial instrument or cryptocurrencies you should be fully informed of the risks and costs associated with trading the financial markets, carefully consider your investment objectives, level of experience, and risk appetite, and seek professional advice where needed.
Fusion Media would like to remind you that the data contained in this website is not necessarily real-time nor accurate. The data and prices on the website are not necessarily provided by any market or exchange, but may be provided by market makers, and so prices may not be accurate and may differ from the actual price at any given market, meaning prices are indicative and not appropriate for trading purposes. Fusion Media and any provider of the data contained in this website will not accept liability for any loss or damage as a result of your trading, or your reliance on the information contained within this website.
It is prohibited to use, store, reproduce, display, modify, transmit or distribute the data contained in this website without the explicit prior written permission of Fusion Media and/or the data provider. All intellectual property rights are reserved by the providers and/or the exchange providing the data contained in this website.
Fusion Media may be compensated by the advertisers that appear on the website, based on your interaction with the advertisements or advertisers.