The Fed’s Tightening Is Creating Illiquidity Pockets And Greater Fragility
Speculators Anonymous | Jun 24, 2022 01:12AM ET
Back in summer 2019, I wrote an article highlighting one of my favorite ways to measure market liquidity and what it means for speculators.
I’m talking about the Chicago Fed’s National Financial Conditions Index (aka the NFCI).
To give you some context: the NFCI’s made up using over 100 different indicators that track financial activity. (Such as debt markets, equity markets, and even the ‘shadow banking’ system).
This means that the NFCI’s a relatively simple way to gauge overall market liquidity.
And as I’ve written before – in this post-1980s hyper-financialized world – liquidity flows are what essentially drive market and asset prices. (Such as stocks, bonds, home prices, etc).
This is why monetary policy and central banks have become so important over the last few decades.
Because when central banks ease monetary conditions (pumping in liquidity) – it inflates asset prices, spurring a ‘boom’. And when central banks tighten (sucking out liquidity) – it does the opposite (deflating asset prices and triggering a ‘bust’).
Thus – following liquidity flows are key for both speculators and policymakers. . .
So – what’s the NFCI showing us today?
Well – according to the most recent reading – liquidity conditions are becoming sharply tighter (aka an illiquidity pocket’s forming).
In fact – the US financial plumbing has grown extremely tight. It’s most so since the COVID outbreak occurred – which caused the global economy to stall in place.
Just take a look at the chart below. . .
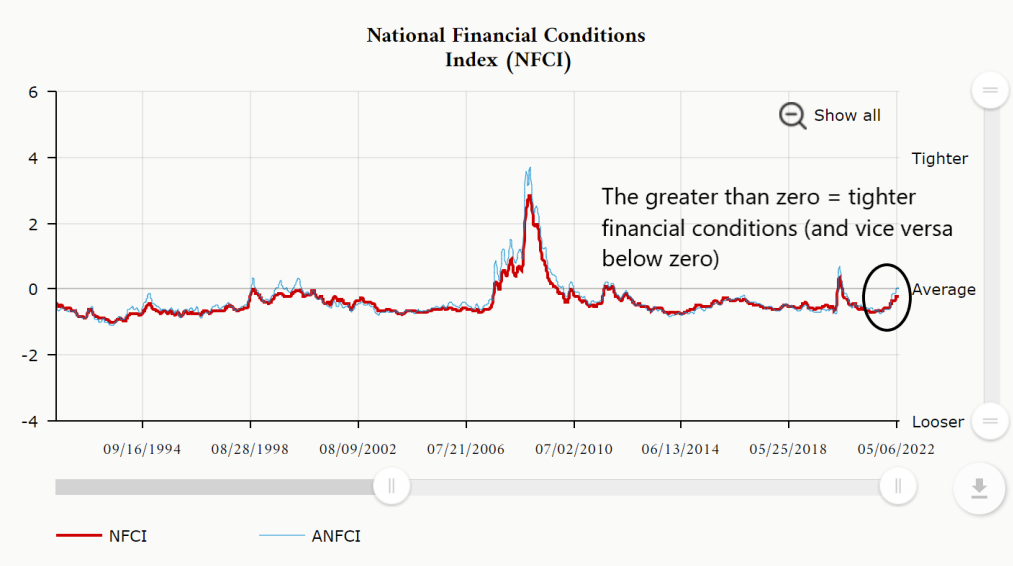
(Note that the NFCI reads inversely. Meaning that anything above zero indicates tighter monetary conditions. And anything below zero signals looser monetary conditions).
Now – this makes sense because the Federal Reserve’s currently in the middle of an aggressive tightening cycle (raising interest rates, etc) to try and curb inflationary pressures.
But I believe this path will only cause greater harm than any benefit.
Let me explain. . .
Most of the inflation wreaking havoc post-COVID is due to supply-side shortages and artificially fueled demand; not monetary inflation.
For instance – after COVID, the global economy screeched to a grinding halt. And still has struggled to regain any solid footing.
Further – the U.S. government (and other major nations) injected serious amounts of stimulus into the economy (i.e. multiple rounds of direct stimulus checks, mortgage and student loan repayment pauses, PPP-loans, etc).
And as taught in ‘Economics-101’: when there’s declining supplies (i.e. COVID supply issues) with artificially higher demand (i.e. excess government induced stimulus); prices will often rise.
Simply put: when supplies drop and demand rises, prices go up.
And this is exactly what’s happened over the last two-years.
For example: from Russian oil embargos (Russia exports delays in Chinese ports due to COVID lockdowns (China’s ports are critical to global supply-chains). And still many more supply-issues effecting markets.
So – what does this all mean?
Well – it means that the Federal Reserve’s stuck between a rock and hard place.
That’s because on the one hand: the Fed’s trying to scale back excess-demand in the economy to bring prices down. So they’re doing the only thing they can – hiking up interest rates to ‘cool’ markets and spending.
Or simply put – they’re trying to bring down demand to match the weaker supply-chains; hopefully easing prices.
But on the other hand – such aggressive tightening will most likely trigger a recession. Which’s already beginning – as US growth in quarter-one 2022 was negative -1.5% .
In fact – Jerome Powell (the Chairman of the Fed) himself recently warned that interest rate hikes may lead to a recession.
And as we’ve seen in the recent NFCI (chart shown above) – financial markets so far tightened dramatically. Thus breeding illiquidity pockets, potential black swans, and weighing down asset markets. (For example: the crypto market’s plunged a whopping -63% year-to-date and the S&P 500 Index is also down -23% in the same period).
And this trend’s going to continue. . .
So – in summary – the Fed appears committed to hiking interest rates in a desperate attempt to bring down prices.
And while I understand their mindset– the negative real-world side-effects continue amplifying.
For instance: plunging financial/asset prices, increased borrowing costs, rising layoffs , slowing growth, etc.
And yet – prices still continue rising.
Why?
Because the Fed can’t solve supply-chain issues with mere interest rate hikes.
But – I expect they will continue tightening, trying to bring demand down.
And most likely everything else with it. . .
Thus as financial tightening increases, so too will economic and financial stress (which always happens in credit-based systems).
I actually feel bad for the Fed (which is rare). They’re stuck in a corner.
And I sure wouldn’t want to have that job.
Trading in financial instruments and/or cryptocurrencies involves high risks including the risk of losing some, or all, of your investment amount, and may not be suitable for all investors. Prices of cryptocurrencies are extremely volatile and may be affected by external factors such as financial, regulatory or political events. Trading on margin increases the financial risks.
Before deciding to trade in financial instrument or cryptocurrencies you should be fully informed of the risks and costs associated with trading the financial markets, carefully consider your investment objectives, level of experience, and risk appetite, and seek professional advice where needed.
Fusion Media would like to remind you that the data contained in this website is not necessarily real-time nor accurate. The data and prices on the website are not necessarily provided by any market or exchange, but may be provided by market makers, and so prices may not be accurate and may differ from the actual price at any given market, meaning prices are indicative and not appropriate for trading purposes. Fusion Media and any provider of the data contained in this website will not accept liability for any loss or damage as a result of your trading, or your reliance on the information contained within this website.
It is prohibited to use, store, reproduce, display, modify, transmit or distribute the data contained in this website without the explicit prior written permission of Fusion Media and/or the data provider. All intellectual property rights are reserved by the providers and/or the exchange providing the data contained in this website.
Fusion Media may be compensated by the advertisers that appear on the website, based on your interaction with the advertisements or advertisers.