The Dollar Index Returns To The Scene Of The Breakout
Dragonfly Capital | May 05, 2015 08:21AM ET
Technicians talk about consolidations and breakouts, patterns and ratios. It seems like they make it up. But quite often there is reason and truth in the art of technical analysis. One example is in the US dollar Index.
Everyone knows that the US dollar has been flying higher. If you follow company fundamentals then you watch this for a clue as to the impact to earnings from overseas. Macro traders look at the dollar strength and search for how it will impact other markets like currencies for example. Technicians just follow the price action for its own potential benefit or to look for relative strength.
What gets lost in technical analysis sometimes is what happens after the breakout. And the US dollar Index gives a good example of what to look for. In December the dollar moved higher into a tightening consolidation zone known as a symmetrical triangle. With 94.50 as a mid point the breaks higher and lower continued to be smaller until in late February it moved hard to the upside. The technical picture then created two targets, 97.50 from the triangle break, and 100.50 as continuation of the first leg higher in a Measured Move.
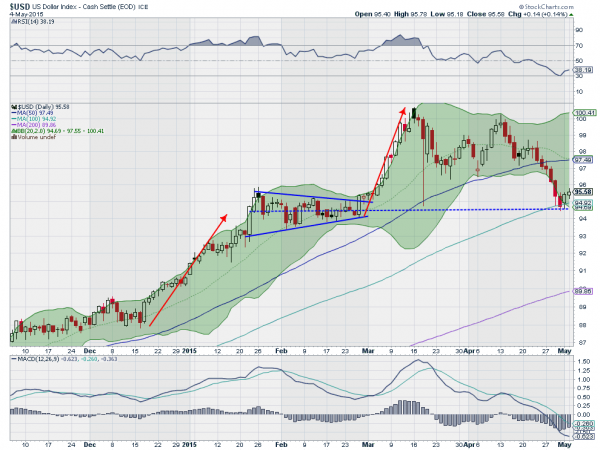
You can see the long red arrow higher measuring the leg to 100.50. And about midway an short consolidation with the small red candle at 97.50. What has happened since then is a pullback though. And this may be the most interesting part of the price action. Last week that pullback did two important things. The first is it touched the 100 day SMA. This has not happened since the rally began in July. And it acts as a kind of recharging of the batteries. As it did so the RSI also hit the technically oversold level.
The second is that the Index returned to the scene of the last break out. It pulled back to the middle of the symmetrical triangle. This often acts as support, and is doing so thus far. A slight bounce Friday and then follow through Monday suggest that the US dollar may be ready for another ascent. At the very least it gives a very good reward to risk trade using a stop at the mid point of the prior triangle.
Disclaimer: The information in this blog post represents my own opinions and does not contain a recommendation for any particular security or investment. I or my affiliates may hold positions or other interests in securities mentioned in the Blog, please see my Disclaimer page for my full disclaimer.
![]()
Trading in financial instruments and/or cryptocurrencies involves high risks including the risk of losing some, or all, of your investment amount, and may not be suitable for all investors. Prices of cryptocurrencies are extremely volatile and may be affected by external factors such as financial, regulatory or political events. Trading on margin increases the financial risks.
Before deciding to trade in financial instrument or cryptocurrencies you should be fully informed of the risks and costs associated with trading the financial markets, carefully consider your investment objectives, level of experience, and risk appetite, and seek professional advice where needed.
Fusion Media would like to remind you that the data contained in this website is not necessarily real-time nor accurate. The data and prices on the website are not necessarily provided by any market or exchange, but may be provided by market makers, and so prices may not be accurate and may differ from the actual price at any given market, meaning prices are indicative and not appropriate for trading purposes. Fusion Media and any provider of the data contained in this website will not accept liability for any loss or damage as a result of your trading, or your reliance on the information contained within this website.
It is prohibited to use, store, reproduce, display, modify, transmit or distribute the data contained in this website without the explicit prior written permission of Fusion Media and/or the data provider. All intellectual property rights are reserved by the providers and/or the exchange providing the data contained in this website.
Fusion Media may be compensated by the advertisers that appear on the website, based on your interaction with the advertisements or advertisers.