The Apple Trading Model Simplified: Follow The Momentum
Dr. Duru | Apr 06, 2015 03:19AM ET
The refinement of the Apple (NASDAQ:AAPL) Trading Model (ATM) continues:
Seven months ago, I re-explained the Apple Trading Model to provide a consistent reference point. In recent weeks, I have stumbled upon a great simplification that I am almost embarrassed to admit completely escaped me all this time: the probability that Apple (AAPL) closes in the same direction as its open is extremely high.
That is, if AAPL opens higher than the previous close, then the odds for AAPL to close higher than the open are extremely high. If AAPL opens lower than the previous close, then the odds for AAPL to close lower than the open are extremely high. Put another way, the odds are very high for AAPL’s close to represent follow-through to the momentum from the open. Here is a graph that breaks out the historical frequencies on a yearly basis, expressing the frequencies as the percent of trading days where Apple’s close FAILS to follow-through on the open’s directional change.
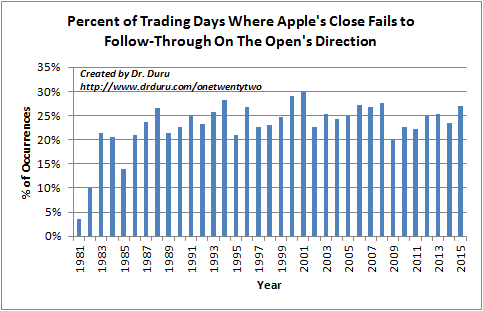
Apple tends to go with the flow of its open
Note the consistency in this frequency for decades. When I look hard enough, I even see a type of cyclical pattern where every seven years or so, AAPL cycles from 20% to 25% or even 30% odds of closing opposite its open. If this cycle holds firm, then 2015 could be the peak of unreliability for this pattern (albeit not a high peak!).
This simplification offers the great advantage of allowing a day-trader to wait until the open to make a trade on the day. No further modeling or conditioning is required. This one trade could be sufficient. The best risk/reward days are those where AAPL opens in one direction and then quickly moves in the opposite direction. A trader can place a directional trade at a discount in this case.
This pattern is so strong that applying the ATM to this case currently only generates three regression trees using the years 2012, 2014, and 2015 as starting points for the historical data. Using 2010, 2011, or 2013 as starting points for the historical data generates a regression tree with a single node – that is, just the plain historical frequency with no further conditions on the input variables. As a reminder, those input variables are the previous daily change of the S&P 500, the previous daily change of AAPL measured from the close prior, the previous daily change of AAPL measured from its open on the same day, the number of days out of the last five AAPL has traded with a gain, the day of the week (starting with Monday as 2), and the month of the year (starting January as 1). See “The Apple Trading Model (Re)Explained” (link above) for details on the model and explanations.
Here are the regression trees that further refine the analysis for the directional trade off Apple’s open. I emphasize these are provided for completeness. I think the above graph says plenty. The classification error on these models ranges from 19 to 26%, very reasonable and refreshingly low. Applying the model to the historical data also generates low actual error rates: 22 to 25%. Clicking on the links downloads the files from the Google (NASDAQ:GOOGL) drive where I store and update the trees periodically. Historical data are current through April 2, 2015 at the time of writing.
Trade from the open
2015
The ATM still makes predictions for the next day of trading. My logistical issue is that I am often hard-pressed to both run the numbers AND make a trade right at the close. Moreover, if AAPL opens the next day in opposition to my trade, it is often unclear whether I should double down, switch directions, or just call it a loss. My previous attempt to solve this problem was a further complication where I added predictions for the direction of AAPL’s close from the open. The above analysis does NOT require guessing at whether AAPL will open up or down.
The error rates on these regression trees have gotten a little more complicated than before. The classification errors are still quite reasonable: 0.25, 0.25, 0.26, 0.27, 0.31, and 0.38 when using historical data starting from 2010, 2011, 2012, 2013, 2014, and 2015 respectively. HOWEVER, the actual error rates when fitting the models to actual history tend to be higher the more data that are used. In other words, while the classification error moves inversely to the amount of data used, the actual error does the exact opposite. The actual errors are 0.47, 0.44, 0.45, 0.44, 0.29, and 0.27 when using historical data starting from 2010, 2011, 2012, 2013, 2014, and 2015 respectively. So for now, I will rely a lot more heavily on the 2014 and 2015 models than the others.
Trade from the previous close
2015
These results tell me even more strongly that at some point I need to investigate whether other machine learning models can improve upon this collection of error rates and generate more consistency and robustness. For example, it is still possible for these two models – trade from the open and trade from the previous close – to contradict each other. (My attempt to use Bayesian models failed miserably). I also need to examine whether the tendency to follow momentum from the open is characteristic of stocks in general or even some important subset of stocks like large and highly liquid stocks.
I end with the latest technicals on Apple’s stock. The 50-day moving average has held up mercifully well despite the deep misgivings
I expressed before. I guess it is actually possible AAPL will now just churn around its 50DMA until earnings in three weeks. Such magnetism seems unlikely with a declining 20DMA seemingly about to force the issue for a resolution (up or down) as it collides into the 50DMA.
Apple (AAPL) continues to find a way to cling to its 50DMA support even as a declining 20DMA is bearing down on the technical support
Be careful out there!
Trading in financial instruments and/or cryptocurrencies involves high risks including the risk of losing some, or all, of your investment amount, and may not be suitable for all investors. Prices of cryptocurrencies are extremely volatile and may be affected by external factors such as financial, regulatory or political events. Trading on margin increases the financial risks.
Before deciding to trade in financial instrument or cryptocurrencies you should be fully informed of the risks and costs associated with trading the financial markets, carefully consider your investment objectives, level of experience, and risk appetite, and seek professional advice where needed.
Fusion Media would like to remind you that the data contained in this website is not necessarily real-time nor accurate. The data and prices on the website are not necessarily provided by any market or exchange, but may be provided by market makers, and so prices may not be accurate and may differ from the actual price at any given market, meaning prices are indicative and not appropriate for trading purposes. Fusion Media and any provider of the data contained in this website will not accept liability for any loss or damage as a result of your trading, or your reliance on the information contained within this website.
It is prohibited to use, store, reproduce, display, modify, transmit or distribute the data contained in this website without the explicit prior written permission of Fusion Media and/or the data provider. All intellectual property rights are reserved by the providers and/or the exchange providing the data contained in this website.
Fusion Media may be compensated by the advertisers that appear on the website, based on your interaction with the advertisements or advertisers.