The ‘Alpha Dow’ Sell In May Method
Jay Kaeppel | Mar 18, 2018 04:11AM ET
“Sell in May” was first popularized by Yale Hirsch of The Stock Trader’s Almanac over four decades ago. At this point there are several versions of this method – Sell at the end of April, sell after the 3rd day of May, sell at the end of May, sell after April 1st when the MACD indicator turns negative, and so on.
The Alpha Dow Method
In this piece we will focus on one of the simplest versions – six months in the market, six months out, no exceptions to the rule. This particular version of “Sell in May” – which I will refer to as the “Alpha Dow Method (or ADM for short) – was introduced to me by Dr. Jerry Minton of Alpha Investment Management, Inc. and it doesn’t get much simpler. The rules are:
*Buy and hold the Dow Jones Industrial Average from November 1st through April 30th.
*Buy and hold the Barclays Intermediate Term Treasuries (NYSE:ITE) (which hold treasuries of the 3-yr. to 7-yr. variety) from May 1st through October 31st.
The Data Used
The first month for which I have data available for both indexes is January 1973, so we will start our test there. Please note that from January 1973 through September 1987 we use price only data for the Dow and total return data for the Barclay’s Index. Starting in October 1987 we use total return data for both the Dow and Barclays (LON:BARC). As such, it should be noted that all returns presented are strictly hypothetical and not based on any actual trading.
The Results
Let’s start with the picture then look at the numbers.
Figure 1 displays growth of $1,000 invested using the Alpha Dow Method (blue line) versus simply buying-and-holding the Dow Jones Industrial Average (red line).
Figure 1 – Growth of $1,000 using the Alpha Dow Method (blue) versus buying-and-holding the Dow Jones Industrial Average (red); 12/1972-2/2018
In sum, cumulative gains from 12/31/72 through 2/28/18 were:
*The Alpha Dow Method = +18,819%
*Dow Jones Industrial Average = +5,229%
*Barclays Treasury Intermediate Index = +1,725%
Again, please note that these are hypothetical numbers based on index data and not on real trading.
While cumulative gains are important, from a trading standpoint it is also essential to have an understanding the ebb and flow of returns over different periods of time. So let’s look separately at 1-yr, 5-year and 10-year returns.
Figure 2 displays the data from look at all rolling 12-month returns.
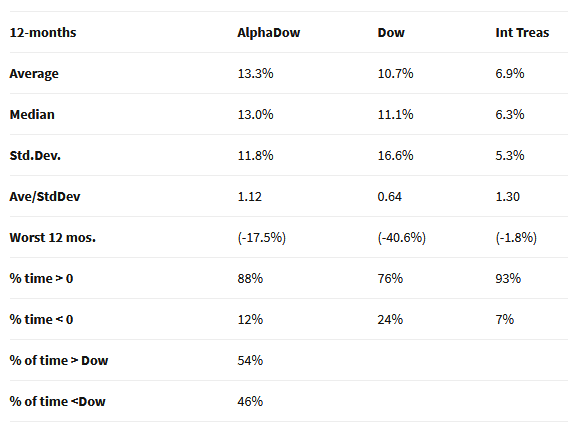
Figure 2 – Rolling 12 month returns
Key things to note: Average annual gain of 13.3%, a 12-month gain 88%of the time (versus only 76% for buy-and-hold) and outperformed buy-and-hold 54% of the time.
Figure 3 displays the data from look at all rolling 5-Year returns.
Figure 3 – Rolling 5-year returns
Key things to note: Average 5-year gain 30% higher than buy-and-hold (90.1% versus 68.9%), a 5-year gain 99.8% of the time (versus only 92% for buy-and-hold) and outperformed buy-and-hold 77% of the time.
Figure 4 displays the data from look at all rolling 5-Year returns.
Figure 4 – Rolling 10-year returns
Key things to note: Average 10-year gain 44% higher than buy-and-hold (277.4% versus 192.5%), a 10-year gain 100% of the time (versus only 92% for buy-and-hold) and outperformed buy-and-hold 96% of the time.
Summary
This blog does not make “recommendations” so I am not suggesting that you adopt this particular strategy. As always, past performance does not guarantee future results. The stock market gained over 5,000% during the past 45 years and the bond market was in the thrall of declining interest rates for most of the past 30 years. A different environment in future years could lead to very different results.
Still it is interesting to note the impressive trade off between performance and simplicity.
Disclaimer: The data presented herein were obtained from various third-party sources. While I believe the data to be reliable, no representation is made as to, and no responsibility, warranty or liability is accepted for the accuracy or completeness of such information. The information, opinions and ideas expressed herein are for informational and educational purposes only and do not constitute and should not be construed as investment advice, an advertisement or offering of investment advisory services, or an offer to sell or a solicitation to buy any security.
Trading in financial instruments and/or cryptocurrencies involves high risks including the risk of losing some, or all, of your investment amount, and may not be suitable for all investors. Prices of cryptocurrencies are extremely volatile and may be affected by external factors such as financial, regulatory or political events. Trading on margin increases the financial risks.
Before deciding to trade in financial instrument or cryptocurrencies you should be fully informed of the risks and costs associated with trading the financial markets, carefully consider your investment objectives, level of experience, and risk appetite, and seek professional advice where needed.
Fusion Media would like to remind you that the data contained in this website is not necessarily real-time nor accurate. The data and prices on the website are not necessarily provided by any market or exchange, but may be provided by market makers, and so prices may not be accurate and may differ from the actual price at any given market, meaning prices are indicative and not appropriate for trading purposes. Fusion Media and any provider of the data contained in this website will not accept liability for any loss or damage as a result of your trading, or your reliance on the information contained within this website.
It is prohibited to use, store, reproduce, display, modify, transmit or distribute the data contained in this website without the explicit prior written permission of Fusion Media and/or the data provider. All intellectual property rights are reserved by the providers and/or the exchange providing the data contained in this website.
Fusion Media may be compensated by the advertisers that appear on the website, based on your interaction with the advertisements or advertisers.