The 1 Chart Every Millennial Should Ignore
Lance Roberts | Nov 11, 2019 01:20PM ET
The media is full of articles about the financial situation of Millennials in today’s economy. According to numerous surveys, they are saddled with too much debt, can’t secure higher wage-paying jobs, and are financially distressed on many fronts. Moreover, this is occurring during the longest financial and economic boom in the history of the United States.
Of course, the media is always there to help by chastising boot-strapped Millennials to dump their savings into the financial markets to chase overvalued, extended, and financially questionable stocks.
To wit:
“Only about half of American families are participating in some way in the stock market, according to research from the St. Louis Fed. When it comes to millennials (ages 23 to 38), about 60% have no direct or indirect exposure to the stock market.
Of course, you don’t definitely don’t have to invest, Erin Lowry, author of ‘Broke Millennial Takes on Investing,’ tells CNBC Make It. It’s not a life requirement. But you should understand what you’re losing out on if you avoid the markets. It’s a shocking amount, Lowry says. ‘You’re going to have to save so much more money to achieve the same goals because the market is helping do some of the work.’”
Great, you have a person with NO financial experience advising Millennials to put their “savings” into the single most difficult game on the planet.
Of course, this is all dependent on the same “myth” we just addressed last week:
“That’s because when you use a high-yield savings account or an investment account with higher returns, you put the magic of compound interest to work for you. When your money earns returns, those returns also generate their own earnings. It’s that simple.”
Here’s the math they use to prove their point.
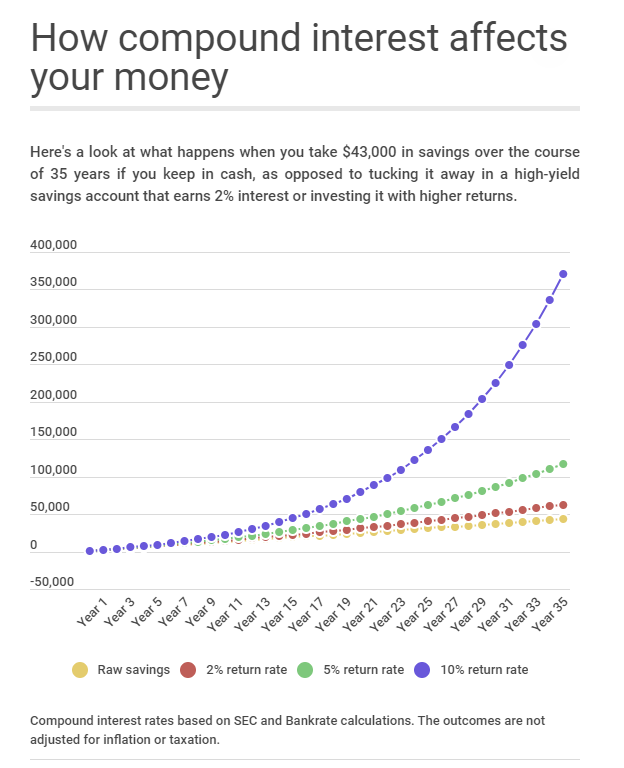
“Let’s say you have $1,000 and add $100 a month to your savings over the course of 35 years. At the end, you’d have $43,000. Not bad. But if you had invested that money and earned a 10% rate of return, which is in line with average historic levels, you’d have over $370,000.”
Of course, you have to have a cool chart to go along with it.
Here’s a little secret.
It’s a complete fallacy.
Trading in financial instruments and/or cryptocurrencies involves high risks including the risk of losing some, or all, of your investment amount, and may not be suitable for all investors. Prices of cryptocurrencies are extremely volatile and may be affected by external factors such as financial, regulatory or political events. Trading on margin increases the financial risks.
Before deciding to trade in financial instrument or cryptocurrencies you should be fully informed of the risks and costs associated with trading the financial markets, carefully consider your investment objectives, level of experience, and risk appetite, and seek professional advice where needed.
Fusion Media would like to remind you that the data contained in this website is not necessarily real-time nor accurate. The data and prices on the website are not necessarily provided by any market or exchange, but may be provided by market makers, and so prices may not be accurate and may differ from the actual price at any given market, meaning prices are indicative and not appropriate for trading purposes. Fusion Media and any provider of the data contained in this website will not accept liability for any loss or damage as a result of your trading, or your reliance on the information contained within this website.
It is prohibited to use, store, reproduce, display, modify, transmit or distribute the data contained in this website without the explicit prior written permission of Fusion Media and/or the data provider. All intellectual property rights are reserved by the providers and/or the exchange providing the data contained in this website.
Fusion Media may be compensated by the advertisers that appear on the website, based on your interaction with the advertisements or advertisers.