Tesla Still Heading To Low $400s
Dr. Arnout ter Schure | May 13, 2021 03:24PM ET
Back in January, using the Elliott Wave Principle (EWP) and technical analyses, I looking for a more significant correction to unfold in Tesla (NASDAQ:TSLA) shares.
As stated then:
“A correction of the primary-degree is a large one, in both time and price, and suggests TLSA should see between $560-600 before primary-V to new all-time highs kicks in. These all-time highs should be in the $1,200-$1,500 region. It is even possible for TSLA to fall back to September-November 2020 levels ($400+/-50). But for now, I find that less likely and will stick to the standard 23.60-38.2% retrace for a 4th wave, just like I showed on the daily chart it has adhered to many times.”
In the subsequent three updates after that, I have kept you abreast of the price movements since. My forecasts were for “a drop to around ~$575, rally to around $800-825, followed by a final drop to $450+/-25.” Reality gave us a drop to $537, a rally to $780 and now TSLA is trading at $575. My predictions were relatively accurate.
Nonetheless, this shows the difference between objective analyses of the price charts and a thorough understanding of what moves stock prices and subjective opinions. For example, I could not care less if Tesla (temporarily) halts its car sales made with Bitcoin. I find Elon Musk’s reasoning hypocritical, but that is an opinion that has no place here. The “why” is immaterial. The charts tell you all you need to know.
Figure 1. TSLA daily and weekly candlestick charts with EWP Count and Technical Indicators:
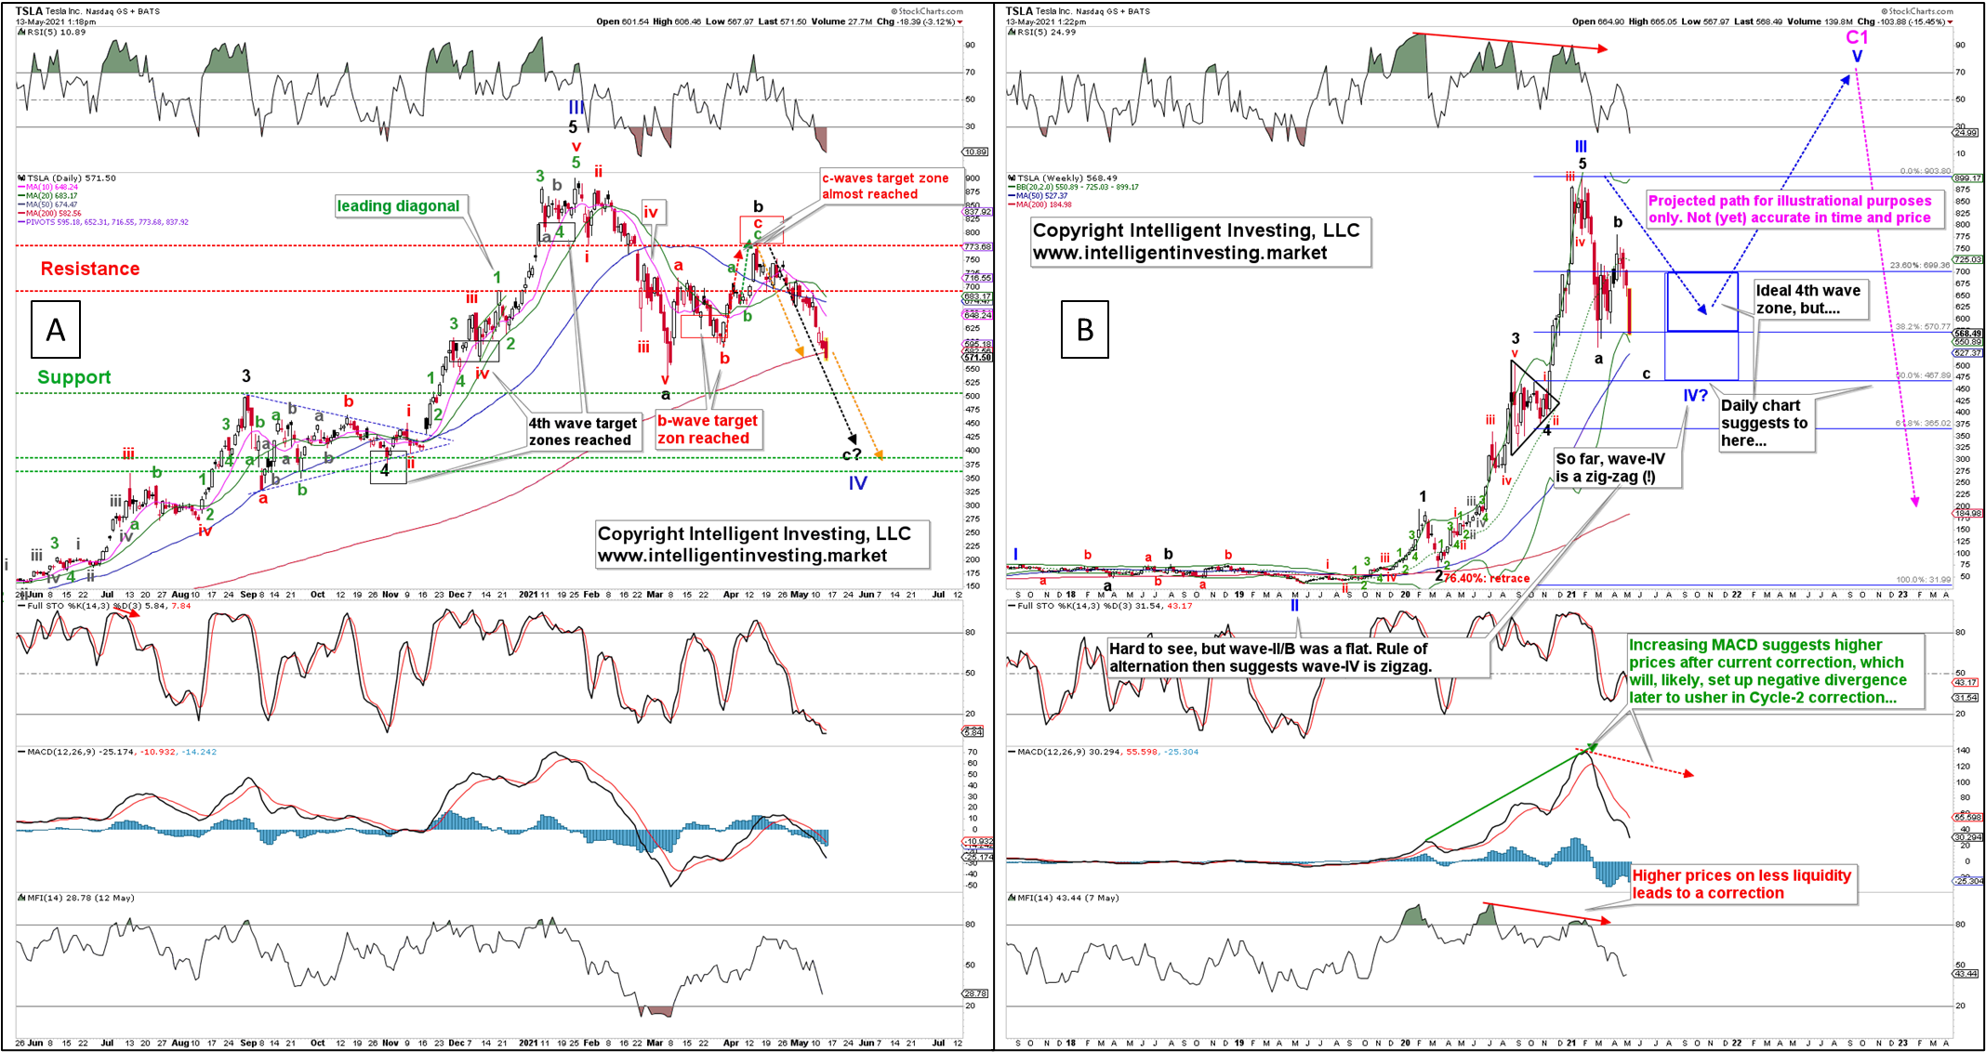
In my previous update, I found:
“A daily close below the recent (green) minor-b wave low at $668 made on April 8 will be the first severe warning for the TLSA bulls that the stock is on its way down to the ideal $450+/-25 zone. Full confirmation of this path lower will be achieved on a daily close below the (red) intermediate-a wave low at $591 made on March 30.”
Fast forward, and TSLA has just done these two “cardinal sins,” as it is currently trading at $575.
TSLA is currently struggling with its 200-day simple moving average. See Figure 1A above. If it cannot hold it, then based on simple symmetry (orange arrows), it can drop to as low as $400, right in the horizontal support zone. For now, all the technical indicators (FSTO, MACD, RSI, MFI) are pointing down and are on a sell, both on the daily and weekly timeframe. Thus, the charts are weak and tell me to continue to look lower.
Bottom line: With a few more twists and turns along the way, I expect $450 +/- 25 to be reached before the last more significant (blue) Primary-V wave to ideally around $1,200+/-100 takes hold (See Figure 1B). Hence, the risk/reward is starting to favor the reward side more and more (25% risk vs. 200% reward), but there are no signs of a meaningful bottom being put in place just yet. Patience is, as usual, prudent. TSLA’s share price will have to rally back above $700 from current levels to prove my thesis wrong.
![]()
Trading in financial instruments and/or cryptocurrencies involves high risks including the risk of losing some, or all, of your investment amount, and may not be suitable for all investors. Prices of cryptocurrencies are extremely volatile and may be affected by external factors such as financial, regulatory or political events. Trading on margin increases the financial risks.
Before deciding to trade in financial instrument or cryptocurrencies you should be fully informed of the risks and costs associated with trading the financial markets, carefully consider your investment objectives, level of experience, and risk appetite, and seek professional advice where needed.
Fusion Media would like to remind you that the data contained in this website is not necessarily real-time nor accurate. The data and prices on the website are not necessarily provided by any market or exchange, but may be provided by market makers, and so prices may not be accurate and may differ from the actual price at any given market, meaning prices are indicative and not appropriate for trading purposes. Fusion Media and any provider of the data contained in this website will not accept liability for any loss or damage as a result of your trading, or your reliance on the information contained within this website.
It is prohibited to use, store, reproduce, display, modify, transmit or distribute the data contained in this website without the explicit prior written permission of Fusion Media and/or the data provider. All intellectual property rights are reserved by the providers and/or the exchange providing the data contained in this website.
Fusion Media may be compensated by the advertisers that appear on the website, based on your interaction with the advertisements or advertisers.