Tesla: Is A Correction To About $575 Under Way?
Dr. Arnout ter Schure | Feb 12, 2021 04:18PM ET
It has almost been a month since I last provided an update on high-flier Tesla Inc (NASDAQ:TSLA). Back then, Tesla was trading at around $846. Based on my Elliott Wave Principle (EWP) count and Technical Analyses (TA) combined, I found:
“TSLA [has] currently less upside reward than downside risk for the intermediate-term (weeks-months), but still has long-term potential (months+), when major-5 completes around current levels ($875-925), Primary-III completes, and Primary-IV will take center stage. … A correction of the Primary-degree is a large one, in both time and price, and suggests TLSA should see between $560-600 before primary-V to new All-time highs (ATHs) kicks in.”
Fast forward, and TSLA peaked on Jan. 24 at $900 and is now trading at around $800.
- The ideal major-5 target zone of $875-925 was reached, and the stock has lost 11% since;
- TSLA has lost 5% since my last update.
Indeed, the reward has not been great.
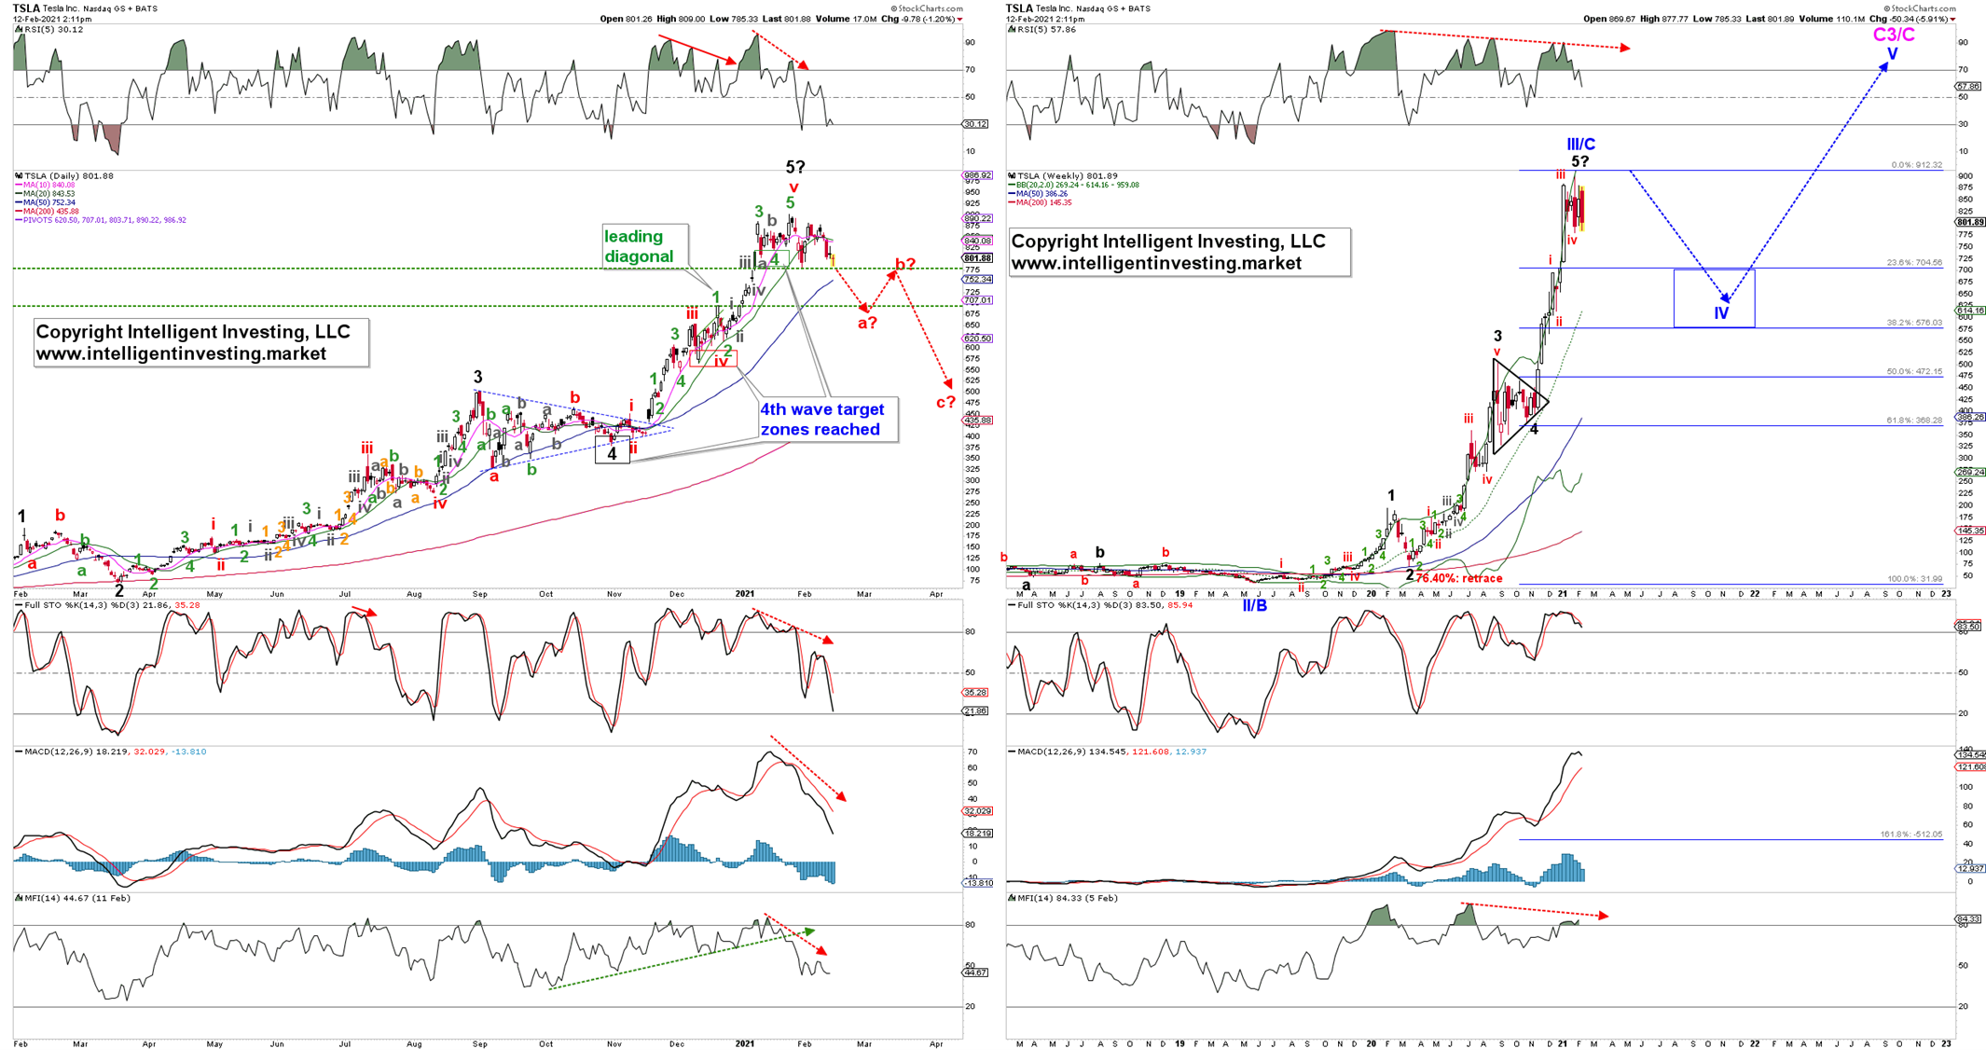
With another month of data in hand, I now find if TSLA loses $775+/-5 support (which was support in early- and late-January), it will likely fall back to the next support zone at $665+/-5. That would then complete a red wave-“a?”. See Figure 1 daily chart.
That level would also fit with the (blue) 23.60% retrace level, as shown in the weekly chart. When a 4th wave does a 38.20% retrace of the prior 3rd wave, it often finds support at the 23.60% retrace (red wave-a?), bounces back to previous support ($775+/-5 in this case, red wave-b?), i.e., the breakdown level, which now acts as resistance and then the next leg lower (red wave-c?) takes hold to the 38.20% retrace at $575+/-5. Thus, the daily and weekly charts align well with the anticipated pattern, support and resistance levels, and ultimate downside targets for the potential (blue) primary-IV that is now forming.
Figure 1. TSLA daily and weekly candlestick chart with EWP Count and Technical Indicators:
The caveat is 4th waves are often the most tricky of corrections and can form many patterns: zig-zags, flats, triangles, double or triple patterns, etc. See here for examples of these distinct EWP patterns. In TA terms, this would be nothing more than a consolidation pattern, aka bull flag, after a +2500% run since 2019, a 1200% run since March 2020, and a +175% run since September 2010. Thus, “some give/digestion of recent gains” is to be expected and completely normal.
Regardless, once the blue Primary IV target zone is reached, I expect the last rally, Primary-V, to new ATHs to complete a large cycle wave. After that, TSLA should see its most extensive haircut in its history.
Bottom line: In the intermediate-term (weeks) TSLA will likely be in a corrective pattern down to $700-575. Longer-term (months), TSLA will most likely still be in a bull that will reach the low to mid-1000s. But, once this bull completes, most of the gains since 2020 will probably be erased. Hence, as always, pick your trading- and investing timeframe carefully and have an exit strategy in place.
![]()
Trading in financial instruments and/or cryptocurrencies involves high risks including the risk of losing some, or all, of your investment amount, and may not be suitable for all investors. Prices of cryptocurrencies are extremely volatile and may be affected by external factors such as financial, regulatory or political events. Trading on margin increases the financial risks.
Before deciding to trade in financial instrument or cryptocurrencies you should be fully informed of the risks and costs associated with trading the financial markets, carefully consider your investment objectives, level of experience, and risk appetite, and seek professional advice where needed.
Fusion Media would like to remind you that the data contained in this website is not necessarily real-time nor accurate. The data and prices on the website are not necessarily provided by any market or exchange, but may be provided by market makers, and so prices may not be accurate and may differ from the actual price at any given market, meaning prices are indicative and not appropriate for trading purposes. Fusion Media and any provider of the data contained in this website will not accept liability for any loss or damage as a result of your trading, or your reliance on the information contained within this website.
It is prohibited to use, store, reproduce, display, modify, transmit or distribute the data contained in this website without the explicit prior written permission of Fusion Media and/or the data provider. All intellectual property rights are reserved by the providers and/or the exchange providing the data contained in this website.
Fusion Media may be compensated by the advertisers that appear on the website, based on your interaction with the advertisements or advertisers.