Technically Speaking: What Exactly Is “RSI?”
Lance Roberts | Jan 23, 2018 08:17AM ET
I get lots of questions from readers regarding the various technical indicators discussed in our Real Investment Reports. While we often discuss the signals these technical signals are indicating, there are often questions involving exactly what these indicators are measuring.
Technical analysis is often dismissed by investors for three reasons:
- A lack of understanding of exactly what technical analysis is,
- An inability to properly apply technical analysis to portfolio management, and;
- The media narrative that “technical analysis” doesn’t work.
There is no “one method” of technical analysis that works for everyone. Every technician uses different methods, indicators, and time-frames for their own analysis. Much depends on your personal investment time frame, risk tolerance and investing behavior.
This article will be the first of several in an attempt to clearly define some of the more common technical indicators we use in our own portfolio management practice and how we apply them.
(Note: we will be providing our specific methods of technical analysis, indicators, etc., in our forthcoming premium section of Real Investment Advice. Click here for pre-subscription information.)
We are going to start our journey with the Relative Strength Index.
What Is RSI
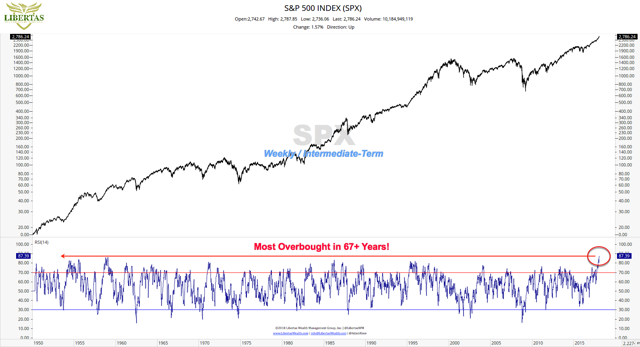
Over the last few weeks, there have been numerous postings about the S&P 500 index and how it has hit a historically high reading on the RSI index. My friend Adam Koos recently posted :
“The first picture below is a weekly chart (or intermediate-term) look at momentum in the S&P 500. Just one week ago, I was posting on social media and explaining that there had only been two times in the last 6-plus decades that the market had been this overbought. Thanks to the second week of January, the market is more overheated today than it has been in more than 67 years!”
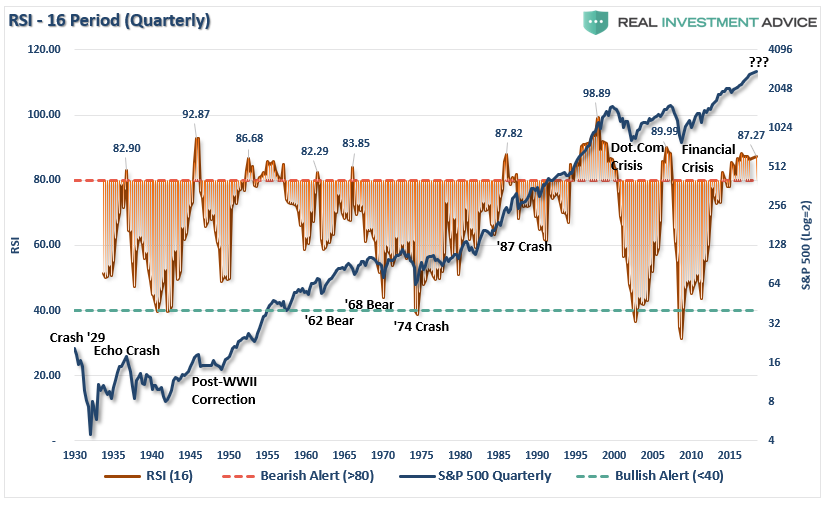
But actually, I will “one-up” Adam on this. This is not only the highest level for RSI on a “weekly” basis but also one of the highest levels on a “4-year quarterly” basis as well.
But exactly what is RSI and how is it calculated?
The relative strength index (RSI) is a “price” momentum indicator that measures the magnitude of recent gains and losses over a specified period of time. It is essentially a measurement of the “speed” of price gains, or losses.
Why do we care about that?
As I have written previously:
“Market crashes are an ’emotionally’ driven imbalance in supply and demand. You will commonly hear that ‘for every buyer, there must be a seller.’ This is absolutely true. The issue becomes at ‘what price.’ What moves prices up and down, in a normal market environment, is the price level at which a buyer and seller complete a transaction.
The problem becomes when the ‘buyer at a higher price’ fails to appear.”
The same goes for “buying stampedes” as well.
At some point, buyers and sellers reach a point of “exhaustion” or more commonly termed “overbought” or “oversold” conditions. This is simply the point at which buyers are unwilling to pay “higher” prices, or sellers are unwilling to accept “lower” prices. Historically, these “overbought” and “oversold” conditions have represented better “entry” or “exit” points for investment capital.
The relative strength index, or RSI, is calculated using the following formula:
RSI = 100 – 100 / (1 + RS)
Where RS = Average gain of up periods during the specified time frame / Average loss of down periods during the specified time-frame
RSI values range from 0 to 100.
Here is a table of the calculation used for the chart above.
The “average” number of periods, usually 14-days, can be any length of period chosen by the investor. The longer the “average” the “slower” the movement of the index. This is where it becomes important to “marry” the duration of the index to your investment horizon. Since our portfolios are “long-term” in nature, our example uses a 16-period quarterly chart (4-years).
Regardless of the “period” used, RSI values of 70 or above indicate that a security is becoming overbought or overvalued, and therefore may be primed for a trend reversal or corrective pullback in price. On the other side of RSI values, an RSI reading of 30 or below is commonly interpreted as indicating an oversold or undervalued condition that may signal a trend change or corrective price reversal to the upside.
RSI is a “tool” that can be used to help identify better entry or exit points for investor capital. However, like any tool, if used improperly it will provide poor results. It is for this specific reason that most investors deem “technical analysis” to be nothing more than “voodoo” and disregard it entirely. But should you?
The reason that technical analysis fails most investors is that their investment time horizon exceeds time-frame of the analysis. For example, most investors are investing capital to perform with the market over the forthcoming year which is why “benchmarking” is so widely adopted. However, they then use very short-term, daily, technical analysis to manage their portfolio. This “duration mismatch” leads to technical signals that create “bad” entry/exit points for investors more commonly known as “whipsaws” or “head fakes.”
In our own practice, our portfolios are designed for longer-term holding periods. Therefore, outside of short-term trading opportunities, we are more interested in the overall “trend” of the market. Our major concern is a more “major” change in the overall trend that could lead to large losses of capital during the portfolio investment horizon. This is why our focus is primarily on monthly and quarterly measures which provide a better “match” to our overall investment goals.
There Is Not Just One
There is no indicator that is an “absolute.” Since markets are driven largely by emotion, large price movements can create “false” buy or sell signals in the RSI, or any “price” based indicator. As Adam stated in his article:
“One can’t simply use a single metric to manage risk in their retirement portfolio. It takes a suite of indicators, observing them all in unison, and making buy and sell decisions based on the weight of the evidence at hand.”
This is why all indicators perform the best when:
- Used in conjunction with other, confirming technical indicators,
- Periods and duration are matched to investment horizons,
- Combined with the overall investment discipline (buy/sell strategy), and;
- Utilizes the K.I.S.S. principle (Keep It Simple, Stupid)
The two biggest problems, in my opinion, that investors run into when trying to implement technical analysis into their portfolio management are:
- They try and use too many different indicators which create contradicting signals which leads to investment “paralysis.” Keep it simple.
- A lack of a “buy” and “sell” discipline which corresponds to the technical signals being given. Any portfolio management process is only as good as the investor discipline to adhere to it.
Currently, the RSI index is registering a level that has only been seen a few times previously throughout history. However, given the longer-term time frames of the indicators we use, these “warning” signals can take some time to “play out” within the markets.
I agree with Adam’s assessment that we are most likely headed for a 5-10% correction sometime this year which would be “healthy” for the markets and provide a “buying” opportunity for the time being. The problem is that it has been so long since investors have even seen a 2-3% correction, a correction of 5%, or more, will “feel” much worse than it actually is which will lead to “emotionally driven” mistakes.
But therein lies the real “value” of technical analysis.
Technical analysis IS NOT some “black box” approach to portfolio management. However, what technical analysis does provide is a method to extract “emotion” from the “buy/sell” process. For us, the fundamentals dictate WHAT we “buy” and “sell” in portfolios, but it is the technicals that drive the WHEN those decisions are implemented.
Over the coming months, we will exploure Bollinger Bands, Williams %R, Trendlines, and more. You may not agree with our methods, but it is what works for us in our process. I hope you find it useful to yours.
Trading in financial instruments and/or cryptocurrencies involves high risks including the risk of losing some, or all, of your investment amount, and may not be suitable for all investors. Prices of cryptocurrencies are extremely volatile and may be affected by external factors such as financial, regulatory or political events. Trading on margin increases the financial risks.
Before deciding to trade in financial instrument or cryptocurrencies you should be fully informed of the risks and costs associated with trading the financial markets, carefully consider your investment objectives, level of experience, and risk appetite, and seek professional advice where needed.
Fusion Media would like to remind you that the data contained in this website is not necessarily real-time nor accurate. The data and prices on the website are not necessarily provided by any market or exchange, but may be provided by market makers, and so prices may not be accurate and may differ from the actual price at any given market, meaning prices are indicative and not appropriate for trading purposes. Fusion Media and any provider of the data contained in this website will not accept liability for any loss or damage as a result of your trading, or your reliance on the information contained within this website.
It is prohibited to use, store, reproduce, display, modify, transmit or distribute the data contained in this website without the explicit prior written permission of Fusion Media and/or the data provider. All intellectual property rights are reserved by the providers and/or the exchange providing the data contained in this website.
Fusion Media may be compensated by the advertisers that appear on the website, based on your interaction with the advertisements or advertisers.