Technically Speaking: Charts Lining Up For Bulls
Hale Stewart | Nov 05, 2019 12:50AM ET
Technically Speaking For November 4
Summary
The latest ISM report on US Manufacturing shows the third month of contraction. 12 out of 18 industries are contracting. Production, employment, and new orders are all down. More concerning are the anecdotal comments (emphasis added):
These comments show the slowdown is broadening and getting worse. This has negative ramifications for industrials (XLB ).
It's not just US manufacturing that's getting hit with a slowdown; it's the global manufacturing sector (emphasis added):
The global manufacturing sector contracted for the sixth successive month in October, according to the latest global PMI™ surveys. The J.P.Morgan Global Manufacturing PMI – a composite index produced by J.P.Morgan and IHS Markit in association with ISM and IFPSM – posted 49.8 in October, remaining below the neutral mark of 50.0. That said, a third successive rise in the PMI provided a further sign that the downturn may have bottomed out in July.
In the latest report, production was slightly positive but employment, new orders, and new export orders were negative. Here's a chart of the headline number:
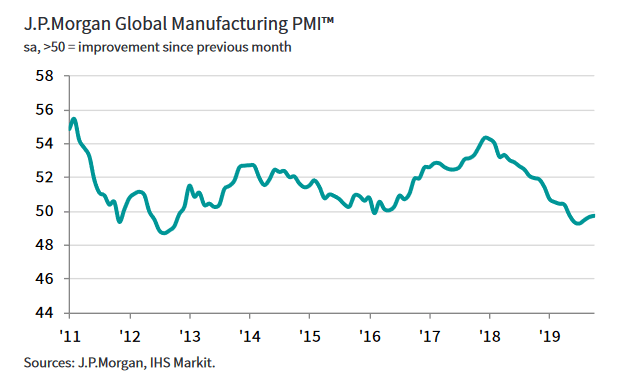
The number declined steadily from the end of 2017. Even if the number gets above 50, it's unlikely that we'll see a major push higher given the current economic backdrop.
Federal Reserve President Clarida explains how the global slowdown could be transmitted to the US:
Let's look at today's performance tables:
The bullish trend in stock performance continues through Monday. Transports had a very strong day, gaining over 2%. After that, the performance drops off a bit. But the second and third best performers were micro and mid-caps, indicating an increased risk appetite. Large-caps were up modestly. At the other end of the spectrum is the long end of the Treasury market, which sold off again.
Today's sector performance was bullish as well. At the bottom of the table are the defensive sectors: healthcare, real estate, staples, and utilities. At the other end is energy -- which has chronically under-performed for a year. Industrials, financials, and basic materials round out the table.
Let's turn to the charts, starting with the Treasury market.
After selling off at the beginning of October, both the IEF and TLT have traded in the lower half of their respective trading ranges. The longer-term trend line (in pink) has been trending lower since October 10.
Meanwhile, the equity markets have been trending higher for the last week.
The IWM is in a solid uptrend, with a major trend line (connecting lows from October 8 and 31) and a minor trend line (connecting lowers from October 14 and 30). The 200-minute EMA started to trend higher in mid-October.
The SPY is also in a solid, month-long trend upwards.
And we've got some solid moves in the industry sectors as well.
Most importantly, technology -- by far the largest component of the SPY and QQQ -- broke through resistance in the lower 80s and is headed higher.
Industrials have printed two solid days higher to break through resistance. Friday's move higher and through resistance had a very strong volume day.
Finally, healthcare is moving solidly higher as well.
Overall, the charts are lining up for the bulls. The indexes are making strong moves higher and some of the more bullish sectors are supporting that move. Best of all, this is happening at the beginning of the week, so we could have more good news to follow.
Original Post
Trading in financial instruments and/or cryptocurrencies involves high risks including the risk of losing some, or all, of your investment amount, and may not be suitable for all investors. Prices of cryptocurrencies are extremely volatile and may be affected by external factors such as financial, regulatory or political events. Trading on margin increases the financial risks.
Before deciding to trade in financial instrument or cryptocurrencies you should be fully informed of the risks and costs associated with trading the financial markets, carefully consider your investment objectives, level of experience, and risk appetite, and seek professional advice where needed.
Fusion Media would like to remind you that the data contained in this website is not necessarily real-time nor accurate. The data and prices on the website are not necessarily provided by any market or exchange, but may be provided by market makers, and so prices may not be accurate and may differ from the actual price at any given market, meaning prices are indicative and not appropriate for trading purposes. Fusion Media and any provider of the data contained in this website will not accept liability for any loss or damage as a result of your trading, or your reliance on the information contained within this website.
It is prohibited to use, store, reproduce, display, modify, transmit or distribute the data contained in this website without the explicit prior written permission of Fusion Media and/or the data provider. All intellectual property rights are reserved by the providers and/or the exchange providing the data contained in this website.
Fusion Media may be compensated by the advertisers that appear on the website, based on your interaction with the advertisements or advertisers.