Markets Concerned By Probable Cotton Deficit
IFC Markets | Oct 14, 2015 09:46AM ET
Markets concerned by probable cotton deficit
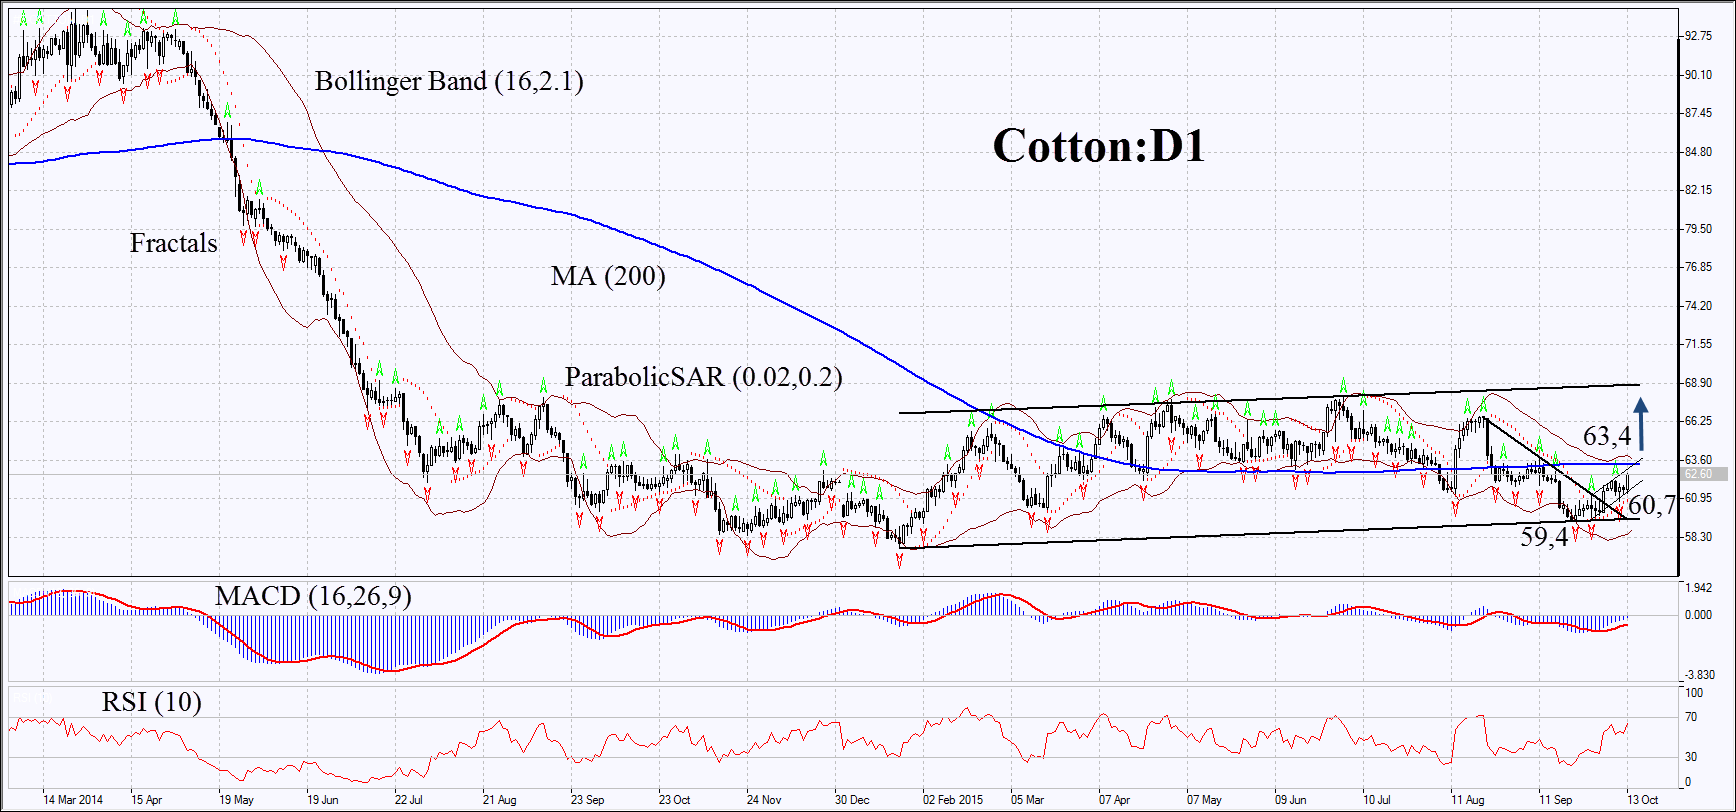
The cotton prices hit the high of three weeks after the US Department of Agriculture (USDA) downgraded its production forecast. The additional factor contributing to price growth is the farmers strike in Pakistan. The cotton chart has formed the channel tilted upwards. Will the price reach the upper channel line?
In October report USDA has downgraded the US cotton production forecast in 2015/16 to 13.34mln bags of 480 pounds each from 13.43mln in September report. The estimation of future cotton yield in India was also revised down from 29mln bags to 28.5mln due to the scanty rainfall. Some market participants state that the US farmers are holding their cotton awaiting higher prices. The current prices are just 9% higher the 6-year low of 57.54 and are threefold lower the high of 2011.

On the daily chart, COTTON:D1 is moving up within the formed ascending price channel. On Tuesday it has surpassed the last Bill Williams fractals high. The MACD and Parabolic indicators give the buy signals. RSI is above 50 but has not yet reached the overbought zone. The Bollinger Bands® are contracting, which may signify lower volatility. The bullish momentum can develop in case the cotton prices surpass the 200-day moving average line and the upper Bollinger Band. Their breakout can serve the point of entry at 63.4. The initial risk limit is possible below the Parabolic indicator signal and the last fractal low at 60.7. The lower price channel line and the third fractal low at 59.4 can be used for placing stop loss. Having opened the pending order, we shall move the stop to the next fractal low following the Parabolic and Bollinger signals every 4 hours. Thus, we are changing the probable profit/loss ratio to the breakeven point. The most risk-averse traders may switch to the 4-hour chart after the trade and place there a stop-loss moving it in the direction of the trade. If the price meets the stop-loss level at 60.7 or 59.4 without reaching the order at 63.4, we recommend cancelling the position: the market sustains internal changes which were not taken into account.
Position Buy Buy stop above 63,4 Stop loss below 60,7 or 59,4

Trading in financial instruments and/or cryptocurrencies involves high risks including the risk of losing some, or all, of your investment amount, and may not be suitable for all investors. Prices of cryptocurrencies are extremely volatile and may be affected by external factors such as financial, regulatory or political events. Trading on margin increases the financial risks.
Before deciding to trade in financial instrument or cryptocurrencies you should be fully informed of the risks and costs associated with trading the financial markets, carefully consider your investment objectives, level of experience, and risk appetite, and seek professional advice where needed.
Fusion Media would like to remind you that the data contained in this website is not necessarily real-time nor accurate. The data and prices on the website are not necessarily provided by any market or exchange, but may be provided by market makers, and so prices may not be accurate and may differ from the actual price at any given market, meaning prices are indicative and not appropriate for trading purposes. Fusion Media and any provider of the data contained in this website will not accept liability for any loss or damage as a result of your trading, or your reliance on the information contained within this website.
It is prohibited to use, store, reproduce, display, modify, transmit or distribute the data contained in this website without the explicit prior written permission of Fusion Media and/or the data provider. All intellectual property rights are reserved by the providers and/or the exchange providing the data contained in this website.
Fusion Media may be compensated by the advertisers that appear on the website, based on your interaction with the advertisements or advertisers.