Taper: Handicapping Fed’s Impact
Chris Ciovacco | Dec 16, 2013 04:06PM ET
Last summer, the Fed said they were using three main criteria for reducing their monthly bond buys – economic growth, employment, and inflation. How do things stand relative to these benchmarks?
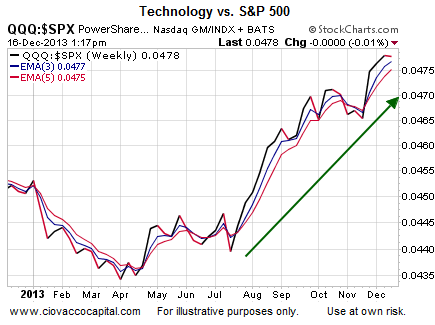
From The Wall Street JournalQQQ ) continues to provide leadership relative to the broader S&P 500 Index (SPY). All things being equal, that sides with the bullish economic outcome camp.
Cyclical Sectors Trying To Perk Up
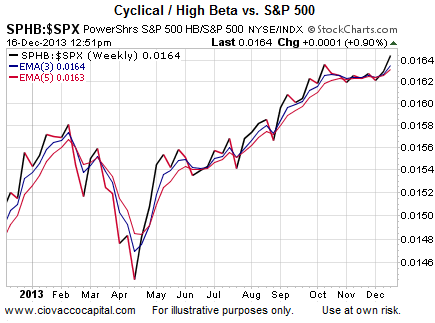
The high beta ETF (SPHB) overweights economically sensitive sectors of the economy, such as financials (XLF), consumer discretionary (XLY), energy (XLE), and technology (XLK). As shown in the chart below, high beta stocks are trying to reestablish their leadership relative to the broader S&P 500. The chart below, in its present form, aligns with investor confidence, rather than taper fears.
Defensive Stocks Lagging
When money managers with a fully-invested-all-the-time mandate are nervous, they tend to overweight defensive consumer staples stocks. Their rationale is consumers will all continue to buy toothpaste and groceries, even during an economic downturn. The chart below shows stocks of consumer staples companies are lagging the broader S&P 500 Index, which is indicative of relatively low fear heading into the Fed announcement. The three steps of a bearish trend change recently “confirmed” weakness in defensive staples.
Two Forms Of Indecisiveness
There was a lot of chatter about the “indecisive nature” of Monday morning’s rally in the equity markets, which is not surprising given what lies ahead this week.
The market’s understandably hesitant nature can be seen in the two charts that follow. The flat blue and red moving averages below on the weekly chart of the S&P 500 tell us bullish economic conviction and bearish economic conviction have been fairly evenly matched in recent weeks.
While defensive and deflation-friendly bonds are still in a clear downtrend relative to growth-oriented stocks, bonds have made some progress in recent weeks. Charts, like the one below, tell us to keep an open mind about the balance of the week and year.
Investment Implications – Tentatively Bullish
We do not need to be a Harvard economics professor to understand why the charts presented above still align with the bullish case for the economy and equities. However, just as the market was unprepared for the “no taper” announcement in September, we have to keep an open mind about another sharp reversal in sentiment following the release of the Fed statement this Wednesday at 2:00 p.m. ET.
Market Is Understandably Hesitant
Since volatility can spike near Fed meetings (remember May and September), part one of this week’s stock market outlook video covers what could be the most important thing in the world of investing – managing volatility. Part two shows longer-term bullish trends remain intact, but observable deterioration is present on shorter time frames.
Trading in financial instruments and/or cryptocurrencies involves high risks including the risk of losing some, or all, of your investment amount, and may not be suitable for all investors. Prices of cryptocurrencies are extremely volatile and may be affected by external factors such as financial, regulatory or political events. Trading on margin increases the financial risks.
Before deciding to trade in financial instrument or cryptocurrencies you should be fully informed of the risks and costs associated with trading the financial markets, carefully consider your investment objectives, level of experience, and risk appetite, and seek professional advice where needed.
Fusion Media would like to remind you that the data contained in this website is not necessarily real-time nor accurate. The data and prices on the website are not necessarily provided by any market or exchange, but may be provided by market makers, and so prices may not be accurate and may differ from the actual price at any given market, meaning prices are indicative and not appropriate for trading purposes. Fusion Media and any provider of the data contained in this website will not accept liability for any loss or damage as a result of your trading, or your reliance on the information contained within this website.
It is prohibited to use, store, reproduce, display, modify, transmit or distribute the data contained in this website without the explicit prior written permission of Fusion Media and/or the data provider. All intellectual property rights are reserved by the providers and/or the exchange providing the data contained in this website.
Fusion Media may be compensated by the advertisers that appear on the website, based on your interaction with the advertisements or advertisers.