Survey: Technical Condition And Portfolio Attributes Of Key Bond Funds
Richard Shaw | Apr 15, 2015 01:26AM ET
There may seem to be a bewildering array of bond fund types. This survey of key bond types may help you chose which if any are appropriate for your particular circumstances and portfolio.
We looked at 24 types of bond funds in terms of price chart slope:
| US Aggregate Bonds | (NYSE:BND) |
| US ST Bonds | (ARCA:BSV) |
| US IT Bonds | (ARCA:BIV) |
| US LT Bonds | (ARCA:BLV) |
| US ST Govt Bonds | (NASDAQ:VGSH) |
| US IT Govt Bonds | (NASDAQ:VGIT) |
| US LT Govt Bonds | (NASDAQ:VGLT) |
| US Extended Duration Govt Bnds | (NYSE:EDV) |
| US ST Corp Bonds | (NASDAQ:VCSH) |
| US IT Corp Bonds | (NASDAQ:VCIT) |
| US LT Corp Bonds | (NASDAQ:VCLT) |
| US HY Corp Bonds | (ARCA:HYG) |
| ST Natl Tax Exempt Bonds | (VWSTX) |
| IT Natl Tax Exempt Bonds | (VWIUX) |
| LT Natl Tax Exempt Bonds | (VWLTX) |
| HY Natl Tax Exempt Bonds | (VWAHX) |
| Total Foreign Bonds (hedged) | (NASDAQ:BNDX) |
| Global Ex US HY Bonds (Euro, Sterling, Loonie) | (NYSE:HYXU) |
| Emerg Mkt Dollar Bonds | (NASDAQ:VWOB) |
| Emerg Mkt HY Dollar Bonds | (NYSE:EMHY) |
| US Inflation Protected Treasuries | (ARCA:VTIP) |
| US Mortgage Backed Bonds | (NASDAQ:VMBS) |
| US Floating Rate Bank Loans | (NYSE:BKLN)) |
| US Preferred Stocks | (NYSE:PFF) |
We included a preferred stocks ETF in the list of “bond” funds. because preferred stocks can be arguably said to be closer to bonds than to common equity in their characteristics; and in this period of very low interest rates preferred stocks have been adopted by many investors as bond substitutes in the search for yield.
Figure 1: Technical Condition of Key Bond Fund Types
The most basic form of chart analysis is a binary determination — is the slope of the price pattern is UP or NOT
Figure 1 below includes 6 binary Yes/No (1/0) measurements of the slope of the price chart (from most important on top of list and least important on bottom of list):
- 12 mo direction (is the 12 month average now higher than 10 days ago? Y/N)
- 3 month av / 12 mo av (is the 3 month average above the 12 mo ave ? Y/N)
- 3 mo direction (is the 3 month average now higher than 10 days ago? Y/N)
- 1 mo / 3 mo (is the 1 month average now higher than 10 days ago? Y/N)
- 1 mo direction (is the 1 month average above the 3 month average? Y/N)
- Price / 1 mo (is the last price above the 1 month average? Y/N)
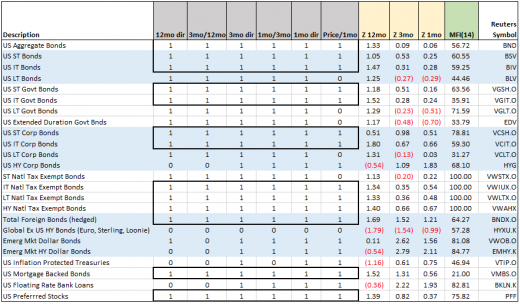
We have highlighted those with all 6 binary answers as Yes (1) with a bold border. Of the 24 (as of Friday April 10, 2015), 13 of the 24 has a “perfect” 6 binary YES (1) slope ratings:
BND, BSV, BIV, VGSH, VGIT, VCSH, VCIT, VWIUX, VWLTX, VWAHX, BNDX, VMBS, PFF
Figure 1 also presents 4 other chart price pattern attributes: 12 mo, 3 mo and 1 mo Z-scores (number of standard deviations the price is from the corresponding moving average price); and the 14-day money flow index (a volume weighted version of the relative strength index — itself a measure of the tendency of the price to position itself within its average daily range).
For Z-scores look out for +/- 2 or more, as being possibly too far from its average to be likely able to maintain that distance. For Money Flow (MFI14) values over 70 are seen as overbought, and under 30 as oversold).
Figure 2: Bond Fund Type Rolling Returns, Trailing Yield and Expense Ratio
Note that some of the fund types have a 12 month trailing yield that is greater than the 12 month total return. That means the price declined (See high yield corporate bonds, short-term municipal bonds, emerging market Dollar denominated bonds, emerging market high yield bonds, inflation protected Treasury bonds, and floating rate bank loans).
No adjustment has been made to express municipal bond yields on an after-tax basis. A 1-to-1 comparison of presented yield between taxable and tax-exempt bonds should not be made — rather an estimate of your pre-tax equivalent yield is up to you to estimate.
Figure 3: Bond Fund Type Spread to Aggregate Bonds, Duration and Credit Quality
Take note of the different credit qualities and average durations, not just the yields on the different fund types.
Also keep in mind that duration for a fund (note is called “average” duration) has potentially quite different implication in a period of changing interest rates when compared to a single bond with a the same duration. A bond fund of any particular average duration may not respond to interest rate changes in the same way that a single bond would do. Similarly two bonds funds of the same average duration may respond differently as well.
Consider these two hypothetical bond funds, each containing 10 individual bonds, and each bond fund having an average duration of 5.5 years. The first fund has 10 bonds each with a duration of 5.5 years. The second fund as 10 bond each with a different duration (1,2,3,4,5,6,7,8,9, and 10 years), also with an average duration of 5.5 years.
When interest rates change, and the shape of the yield curve changes, these two funds will no react to the same degree.
This is not even to consider the mix of credit qualities that might react differently due to perceived changes in credit risk that may be happening at the same time that interest rates are changing. And, to the extent that the fund uses derivatives to emulate bonds, a liquidity crisis could create an entirely different ball game for those funds versus funds that only hold real bonds.
Figure 4 Bond Fund Type Spread of Credit Qualities Within Each Fund
When thinking about your risk level, it may be helpful to look not only at average credit quality, but also the spread of quality levels that result in the average quality level, as shown in Figure 4.
Figure 5: Bond Fund Type Composition by Type of Bonds
When thinking about your risk level, it may be helpful to look not only at average credit quality (and the spread of qualities), but also at the type of bond: government issued, corporate issued, securitized, municipal and synthetic (derivative).
Trading in financial instruments and/or cryptocurrencies involves high risks including the risk of losing some, or all, of your investment amount, and may not be suitable for all investors. Prices of cryptocurrencies are extremely volatile and may be affected by external factors such as financial, regulatory or political events. Trading on margin increases the financial risks.
Before deciding to trade in financial instrument or cryptocurrencies you should be fully informed of the risks and costs associated with trading the financial markets, carefully consider your investment objectives, level of experience, and risk appetite, and seek professional advice where needed.
Fusion Media would like to remind you that the data contained in this website is not necessarily real-time nor accurate. The data and prices on the website are not necessarily provided by any market or exchange, but may be provided by market makers, and so prices may not be accurate and may differ from the actual price at any given market, meaning prices are indicative and not appropriate for trading purposes. Fusion Media and any provider of the data contained in this website will not accept liability for any loss or damage as a result of your trading, or your reliance on the information contained within this website.
It is prohibited to use, store, reproduce, display, modify, transmit or distribute the data contained in this website without the explicit prior written permission of Fusion Media and/or the data provider. All intellectual property rights are reserved by the providers and/or the exchange providing the data contained in this website.
Fusion Media may be compensated by the advertisers that appear on the website, based on your interaction with the advertisements or advertisers.