Surprise #1: Very Large Drop in T2108; Crying Over Apple)
Dr. Duru | Mar 15, 2012 01:26AM ET
: 63%
VIX Status: 15.3%
General (Short-term) Trading Call: Hold
Commentary
T2108 dropped so far and so fast, I had to write an email to the good folks at Worden just to verify the numbers. They indeed verified that T2108 is at 63%. This is an incredible fall of 10 percentage points from Tuesday’s overbought reading, especially given the S&P 500 essentially remained flat with Tuesday’s close.
Normally, I would call this a HUGE bearish divergence: it suggests that once again the rank of leaders driving the index higher are thinning out. However, I am quickly reminded that the historical data tell us that the path higher from the previous extended overbought period will be full of churn and frequent trips in and out of overbought territory. So, I am reserving judgment for at least another day. Follow-through selling tomorrow will raise my yellow flag higher. And, of course, a complete reversal of Tuesday’s impressive breakout, puts me right back into a pool of skepticism about the rally.
Given Wednesday’s overall performance, it is no surprise that my bullish “trial balloons” received no love. I should have stuck with Apple (AAPL)! CSX Corporation (CSX) sunk like a lead balloon and is once again hovering over critical support. The on-going weakness of transports continues to hang like a dark cloud over the picnic.
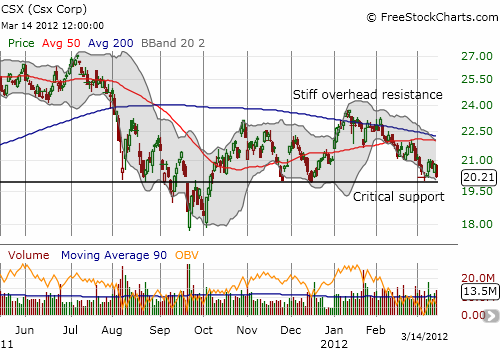
CSX is again dangerously close to breaking support...and throwing cold water on the party
Caterpillar (CAT) underperformed with almost a 1% loss. I am looking for follow-through in CAT to confirm my reasons for being bullish.
The VIX attempted to bounce from its lows. As promised, I bought puts on VXX in response. This trade reminded me how I let go of my previous tranche of VXX puts too early.
Finally, the MOST interesting action of the day happened intraday. Out of nowhere, the S&P 500 dropped just as momentum was building to close at fresh multi-year highs.
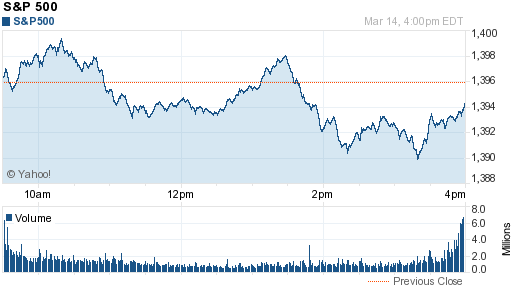
The S&P 500's momentum hits a brick wall but buyers rush back in by the close
The intrigue intensified given Apple (AAPL) fell in tandem. The stock had just rallied 10 points in about one hour before the wheels seemed to fall off in a climactic sell-off. In a testament to Apple’s core strength (pun intended), Stocktouch to generate the following list of Apple’s ranking in performance against its big-cap cousins in high-tech over time:
- 5-year: #2 (SXCI is #1)
- 1-year: #2 (EQIX is #1)
- 6-month: #6
- 3-month: #3
- 1-month: #5
- 1-week: #3
- 1-day: #3
Now MY tears are very real. I sold my Apple April $590 call three weeks ago to lock in profits and prepare to buy at lower prices. The darn thing has increased in value 10 TIMES since then…
Charts below are the latest snapshots of T2108 (and the S&P 500) Refresh browser if the charts are the same as the last T2108 update.
Black line: T2108 (measured on the right); Green line: S&P 500 (for comparative purposes)
Full disclosure: long SDS and VXX; long VXX puts; long CAT shares and calls; long CSX calls; long Apple calls in spirit
Trading in financial instruments and/or cryptocurrencies involves high risks including the risk of losing some, or all, of your investment amount, and may not be suitable for all investors. Prices of cryptocurrencies are extremely volatile and may be affected by external factors such as financial, regulatory or political events. Trading on margin increases the financial risks.
Before deciding to trade in financial instrument or cryptocurrencies you should be fully informed of the risks and costs associated with trading the financial markets, carefully consider your investment objectives, level of experience, and risk appetite, and seek professional advice where needed.
Fusion Media would like to remind you that the data contained in this website is not necessarily real-time nor accurate. The data and prices on the website are not necessarily provided by any market or exchange, but may be provided by market makers, and so prices may not be accurate and may differ from the actual price at any given market, meaning prices are indicative and not appropriate for trading purposes. Fusion Media and any provider of the data contained in this website will not accept liability for any loss or damage as a result of your trading, or your reliance on the information contained within this website.
It is prohibited to use, store, reproduce, display, modify, transmit or distribute the data contained in this website without the explicit prior written permission of Fusion Media and/or the data provider. All intellectual property rights are reserved by the providers and/or the exchange providing the data contained in this website.
Fusion Media may be compensated by the advertisers that appear on the website, based on your interaction with the advertisements or advertisers.