Supercharge Your Bitcoin Trading With These 3 On-Chain Metrics
Crypto Briefing | May 19, 2020 12:38AM ET
These three little-known on-chain metrics will help you gain an edge in your Bitcoin and altcoin trading.
For the first time in history, on-chain blockchain data gives investors a glimpse of who is on the other side of a trade. A look at these three particular on-chain metrics can help Bitcoin traders enter and exit profitable trades.
Unlike stocks and bonds, Bitcoin records transactions to a public ledger. A public ledger is a record-keeping system that tracks everyone who has made a transaction on the network, disclosing wallet balances and transaction histories.
With the proper analysis, this information can help identify bullish or bearish momentum around not just Bitcoin, but any blockchain-based cryptocurrency. Here are the three most important metrics to up your crypto-trading game.
1. Support and Resistance by the Number of BTC Holders
IntoTheBlock’s “In/Out of the Money Around Price” (IOMAP) model identifies investors’ average purchase price of a cryptocurrency versus its current price. The model analyzes crypto addresses (wallets) that bought at an average price above or below the current market price.
Addresses that bought at an average price lower than the current market price are “In the Money” because they would realize a profit if they sold. On the flip side, addresses that bought at an average price higher than the current market price are “Out of the Money” because they would realize a loss if they sold.
Research on investor behavior shows that traders are reluctant to sell assets at a loss. As a result, IOMAP data is useful for predicting pivotal psychological support and resistance levels.
Right now, out of all Bitcoin addresses, more than 72% are “In the Money,” while 28% are “Out of the Money.” These figures indicate that the investor base behind BTC is confident about upwards price action in the future. Meanwhile, in the event of a correction, the bellwether cryptocurrency would have enough support to absorb losses from a sudden decline.
Looking at IOMAP cohorts shows that more than 1.5 million addresses bought over 976,000 BTC at an average price of about $9,500. As such, the $9,300-$9,600 price level is a massive supply wall and will provide strong support if BTC were to decline.
On the reverse, the resistance levels above $9,780 are weaker than the underlying support. If Bitcoin breaks above these levels, investors who have been sitting in the red may unload their holdings, keeping prices down. Yet, there are only 755,000 addresses that purchased about 500,000 BTC above the $9,600-$9,900 resistance level. If BTC prices punch above this resistance level, then there are few barriers preventing further movement beyond $10,000.
2. Watching Bitcoin Whales to Predict Prices
Another critical metric to watch is the number of large transactions on the Bitcoin network (or any other blockchain). Large transactions indicate movement from holders who own millions of dollars of Bitcoin, colloquially known as whales by crypto traders. These whales have a disproportionate impact on prices because of their enormous holdings and their ability to coordinate buying and selling activity.
For Bitcoin, IntoTheBlock defines this metric by looking at on-chain transactions with a value greater than $100,000. By measuring the number of large transactions, it is possible to estimate the composition of the investor base around some particular price action.
Based on historical data, when the number of large transactions starts to increase, then Bitcoin prices tend to follow. When the number of large transactions peak, then BTC prices begin to drop.
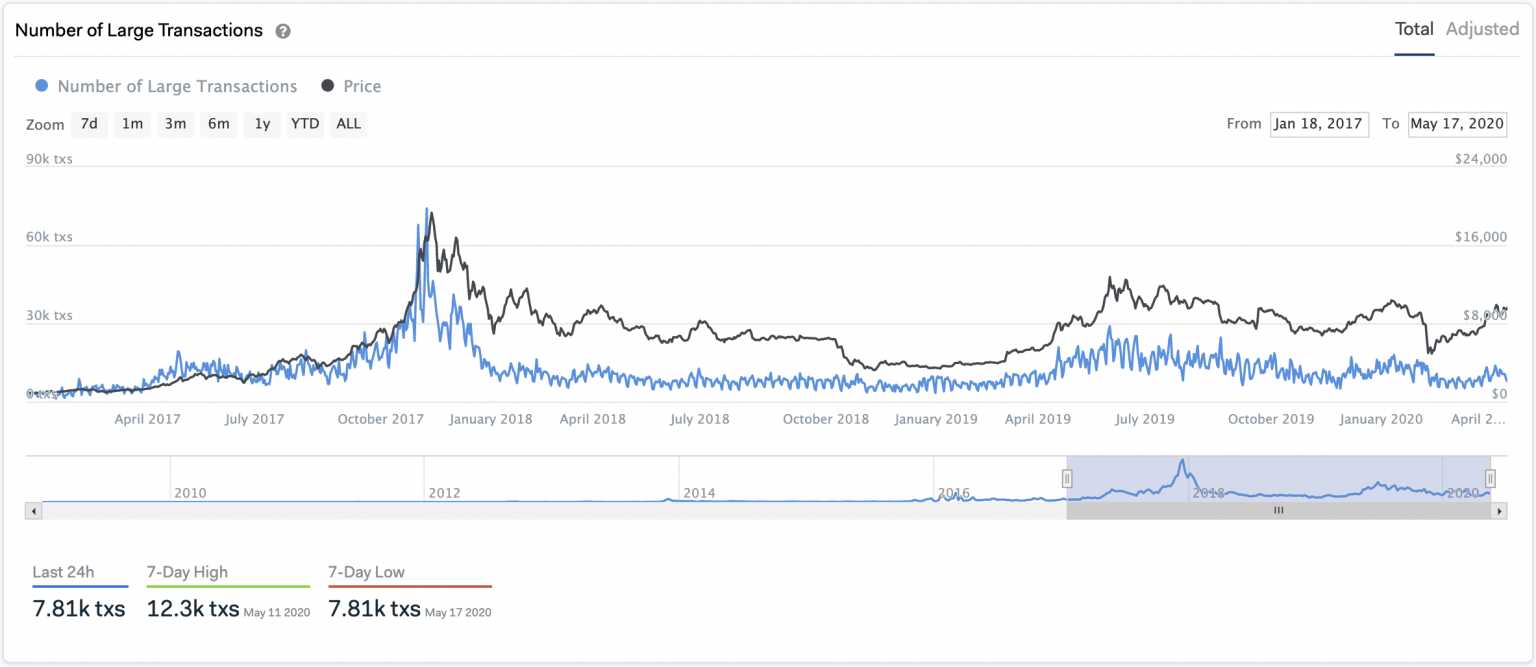
The number of large transactions has steadily risen over the past three months, increasing from 5,500 to nearly 14,000 transactions per day. During the same time, Bitcoin surged from mid-March’s low of $4,000 to a recent high of almost $10,000.
When the number of large transactions peaked on May 7, BTC took a 20% nosedive before the Bitcoin halving.
Unfortunately, this metric has yet to recover, meaning Bitcoin may consolidate before continuing its uptrend.
3. Bitcoin Network Growth as a Sign of Strength
The final metric to look at is network growth. Network growth helps gauge the number of new users joining the Bitcoin ecosystem. The on-chain metric measures the number of new addressees created daily, based on a trailing average.
Brian Quinlivan, Market and Social Media Director at Santiment, said that an increase in the number of new addresses is one of the most accurate price “foreshadowers.”
“Generally, [we can] see that a rising network growth leads to a rising price of any project over time, in most cases. On the flip side, declining network growth for a long enough stretch can usually indicate a future slumping price with the lack of newly created addresses constantly in-flowing the coin or token.”
Under this premise, a look at Bitcoin’s network growth can help determine where prices will head next.
IntoTheBlock’s “Daily Active Addresses” model shows that the number of new addresses created on the Bitcoin network topped-out on May 12 at a high of 510,000 addresses per day, calculated on 3-month trailing average. Since then, Bitcoin’s network growth has declined by new active addresses per day.
At press time, only 360,000 new addresses were created based on this trailing average, which is another bearish sign for BTC.
Moving Forward
Individually, these different on-chain metrics may seem to provide an ambiguous outlook about future Bitcoin prices. Taken in aggregate, however, they can provide actionable information about when to enter and exit trades.
Using current data, for example, since the number of large transactions and new addresses are declining, it seems more likely that Bitcoin prices will spend more time consolidating—or even drop. Yet, when factoring in IOMAP data, which shows 1.5 million addresses hold more than 976,000 BTC around $9,500, a massive support wall must first break to add credence to the pessimistic outlook.
While waiting for confirmation, traders should pay close attention to the number of large transactions and new address growth. Given the strength of the $9,500 hurdle, a spike in either of these metrics may catalyze a further upwards advance.
By employing these on-chain indicators, with a good dose of patience, it is possible to minimize risk while profiting from Bitcoin’s price action.
Trading in financial instruments and/or cryptocurrencies involves high risks including the risk of losing some, or all, of your investment amount, and may not be suitable for all investors. Prices of cryptocurrencies are extremely volatile and may be affected by external factors such as financial, regulatory or political events. Trading on margin increases the financial risks.
Before deciding to trade in financial instrument or cryptocurrencies you should be fully informed of the risks and costs associated with trading the financial markets, carefully consider your investment objectives, level of experience, and risk appetite, and seek professional advice where needed.
Fusion Media would like to remind you that the data contained in this website is not necessarily real-time nor accurate. The data and prices on the website are not necessarily provided by any market or exchange, but may be provided by market makers, and so prices may not be accurate and may differ from the actual price at any given market, meaning prices are indicative and not appropriate for trading purposes. Fusion Media and any provider of the data contained in this website will not accept liability for any loss or damage as a result of your trading, or your reliance on the information contained within this website.
It is prohibited to use, store, reproduce, display, modify, transmit or distribute the data contained in this website without the explicit prior written permission of Fusion Media and/or the data provider. All intellectual property rights are reserved by the providers and/or the exchange providing the data contained in this website.
Fusion Media may be compensated by the advertisers that appear on the website, based on your interaction with the advertisements or advertisers.