Strong Price Action For Global Equities
Aksel Kibar | Aug 07, 2016 02:41AM ET
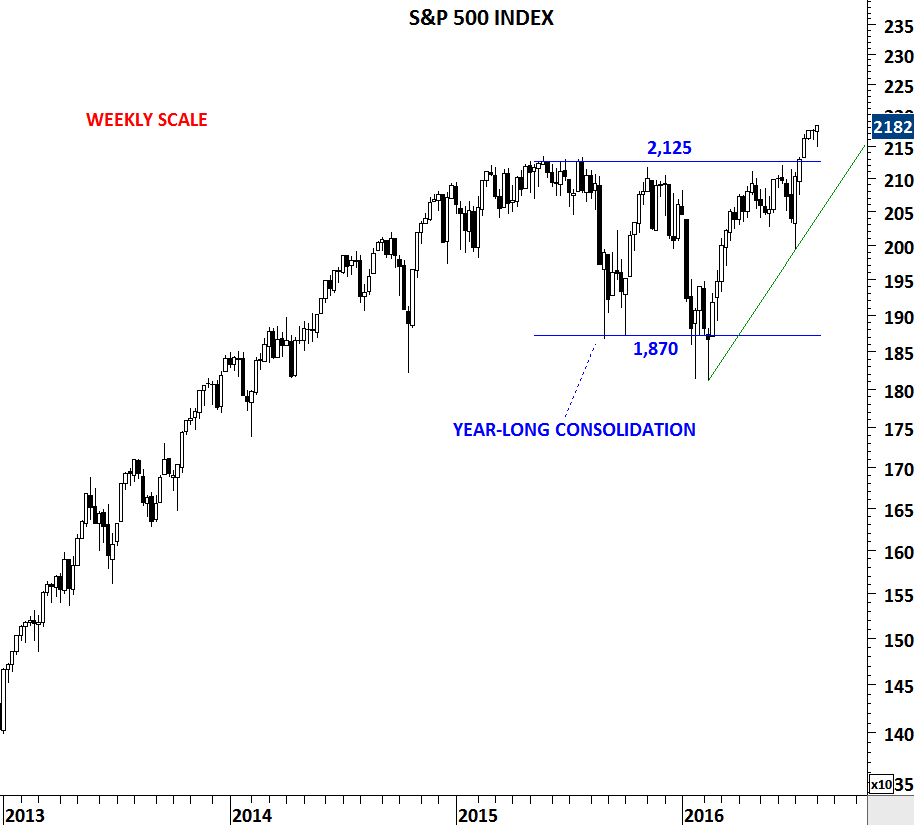
Global equities get a boost from both S&P 500 and Dow Jones Industrial averages breaking out to all-time high levels. In mid-July, S&P 500 index cleared the strong resistance at 2,125 and recorded an all-time high. This was followed by two weeks of consolidation in a very tight range. With Friday's strong close it is likely that U.S. equities and global equities in general will resume their up trends in the following months.
|
On the weekly chart, the resistance at 2,125 levels will now become support. Upward break from the year-long consolidation will gain momentum and resume higher as long as the index remains above 2,125 levels.
|
|
|
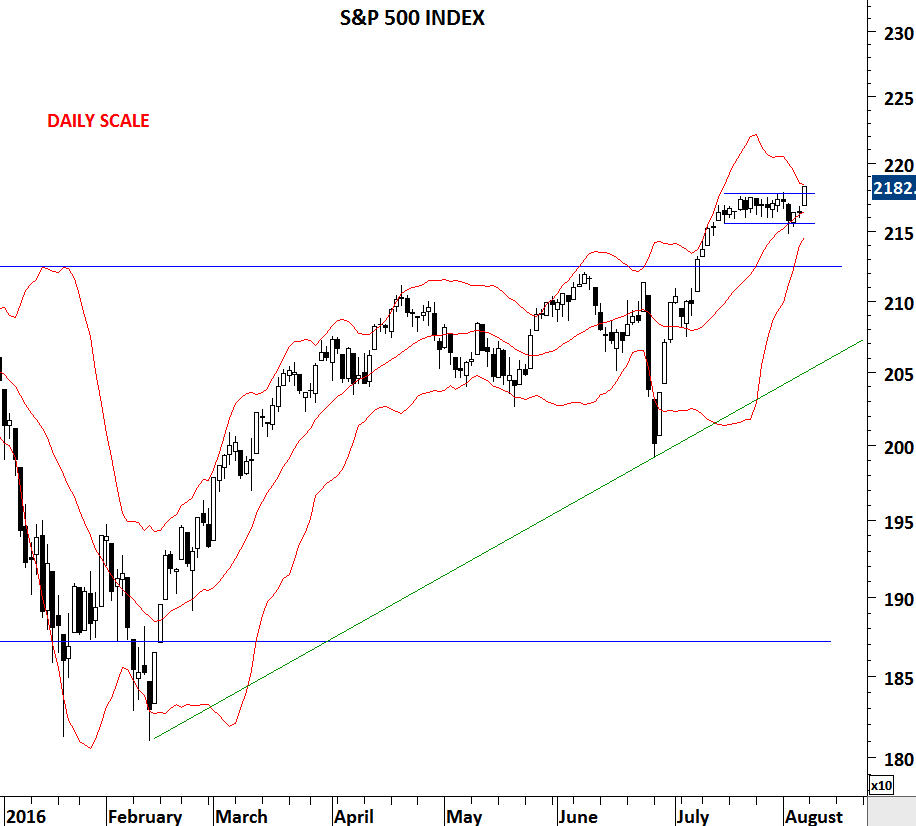
On the daily scale, low volatility registered by contracting Bollinger bands® suggests a strong directional move is likely to follow. A breach of the upper band in the following trading sessions will confirm this.
|
|
 Get The News You Want
Read market moving news with a personalized feed of stocks you care about.
Get The App
|
MSCI all-country World Equity Index that captures large and mid-cap representation across 23 Developed Markets and 23 Emerging Markets countries, formed a clear upward trend channel. Long-term uptrend resumes between the boundaries of this channel with the historical high standing at 443 levels.
|
|
The weekly chart of the MSCI All Countries World index is more constructive and suggests a year-long H&S bottom is now completed. Price target for the H&S bottom stands at 460 levels. 2015 high level is at 443 levels. Breakout from this bullish chart pattern can target 443-460 area in the following months. Failure to remain above 405 levels will negate this bullish outlook.
Written By:
Aksel Kibar