Strong 30-Day Charts And Contributions From Tech And Communication Services (Technically Speaking)
Hale Stewart | Nov 20, 2019 12:44AM ET
Summary
Homebuilders are feeling confident (emphasis added):
Builder confidence in the market for newly-built single-family homes edged one point lower to 70 in November, according to the latest National Association of Home Builders/Wells Fargo Housing Market Index (HMI) released today. The past two months mark the highest sentiment levels in 2019.
“Single-family builders are currently reporting ongoing positive conditions, spurred in part by low mortgage rates and continued job growth,” said NAHB Chairman Greg Ugalde, a home builder and developer from Torrington, Conn. “In a further sign of solid demand, this is the fourth consecutive month where at least half of all builders surveyed have reported positive buyer traffic conditions.”
The fundamental backdrop is positive: unemployment is low, wages are rising, the stock market is near highs (which increases confidence), and rates are low. As a result, new home sales are just shy of 12-month highs as are existing home sales.
China is cutting rates modestly (emphasis added):
China's central bank has lowered its new benchmark lending rates in a bid to guide borrowing costs down as the economy expands at its slowest pace in decades.
The People's Bank of China set the one-year Loan Prime Rate--the new reference rate replacing the previous benchmark interest rates--at 4.25% on Tuesday, down from 4.31% before. The LPR is also below the one-year benchmark lending rate that now stands at 4.35%.
While most countries would be envious of China's macroeconomic statistics, most have been trending lower, including GDP growth, retail sales, and industrial production. On the plus side, the manufacturing PMI recently turned positive and the service sector is still expanding. However, this drop means the central bank is concerned enough about downside risks to lower rates.
Is the latest yield curve inversion "normal" or "abnormal?" Work by Kim Kowalewski posted over at Econbrowser argues it's "normal." The author plotted the total changes in the 3-month and 10-year Treasuries on a scatterplot:
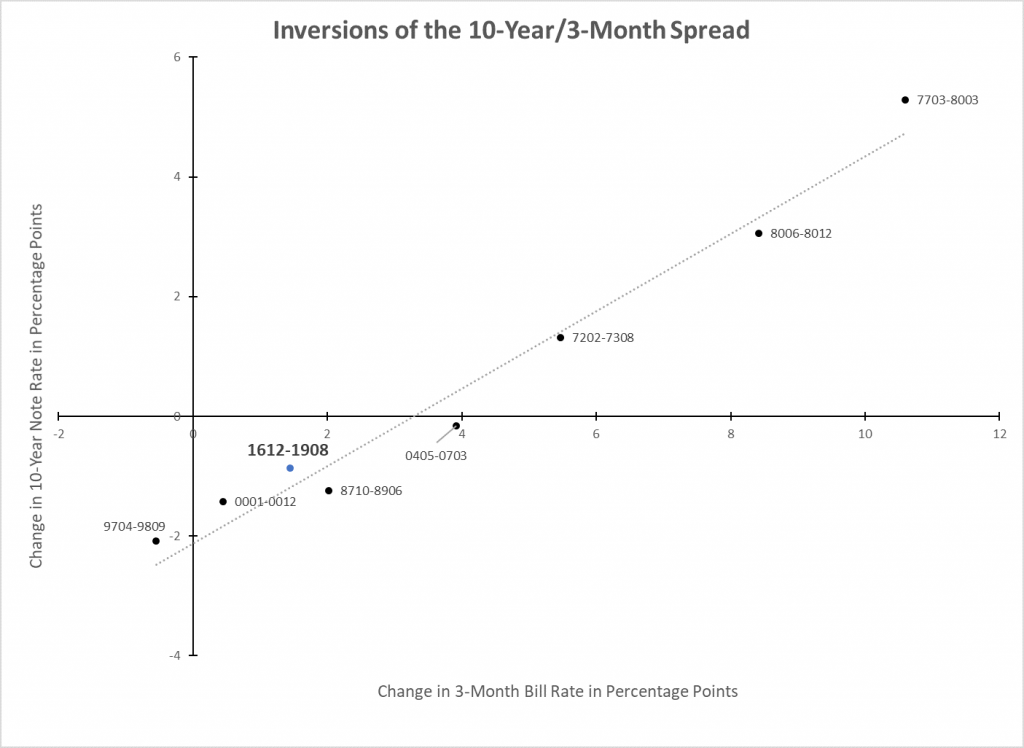
The current episode is located where most of the other inversions are, making this episode more "normal." Here's the author's conclusion (emphasis added):
The second point is that the change in the 10-year Note during the latest episode (point labeled “1612-1908”) is close to the estimated relationship.[6] In other words, the change in the 10-year Note rate during the latest inversion doesn’t appear to be unusual given the change in the 3-month Bill rate. It’s true that the 10-year Note rate declined during the recent episode, but it also declined during the other episodes since the late 1980s. The finding suggests that the unusual factors cited earlier did not have much of an impact on the change in the 10-year Note rate in the latest episode or were offset by other factors.
Food for thought.
Let's turn to today's performance table.
A bit of an odd day. The top four spots were inter-mixed with small-cap stocks and long-end Treasuries -- definitely a market odd couple. The biggest equity winner was up 0.56%, the second-best performer gained 0.37%. Large-cap stocks were trading right around 0%, making the day an overall wash for them.
Sector performance is also mixed, with the top four spots inter-mixed between defensive and aggressive sectors. The two worst performers were consumer discretionary -- which was hit by negative news from Home Depot (NYSE:HD) -- and the energy sector.
Overall, however, the underlying, 30-day trend is still positive.
The iShares Russell 2000 (NYSE:IWM) is up about 7 points since mid-October. Prices formed a counter-trend consolidating pattern between November 5 and 15, but resumed their move higher today. Notice the 200-minute EMA, which has been in a consistent uptrend for the entire period.
The Invesco QQQ Trust (NASDAQ:QQQ) is also in a solid and consistent uptrend, as is ...
... the SPDR S&P 500 (NYSE:SPY), which has formed three separate uptrends since November 18.
Just as importantly, the largest sectors of the SPY have also been moving higher.
Technology has a very bullish chart. Not only is the 200-minute EMA moving higher, but so are the 10, 20, and 50-minute EMAs. Overall, tech is up about 10%.
Financials are also moving higher but in a far more inconsistent manner. Still, they're up about 10% in the last 30 days.
Telecommunication services also have a consistent and strong uptrend in place. They're up about 5%.
The bulls are still in charge. The indexes are moving higher, today led by small-caps. The aggressive sectors are contributing to gains while also having solid, short-term charts.
Original Post
Trading in financial instruments and/or cryptocurrencies involves high risks including the risk of losing some, or all, of your investment amount, and may not be suitable for all investors. Prices of cryptocurrencies are extremely volatile and may be affected by external factors such as financial, regulatory or political events. Trading on margin increases the financial risks.
Before deciding to trade in financial instrument or cryptocurrencies you should be fully informed of the risks and costs associated with trading the financial markets, carefully consider your investment objectives, level of experience, and risk appetite, and seek professional advice where needed.
Fusion Media would like to remind you that the data contained in this website is not necessarily real-time nor accurate. The data and prices on the website are not necessarily provided by any market or exchange, but may be provided by market makers, and so prices may not be accurate and may differ from the actual price at any given market, meaning prices are indicative and not appropriate for trading purposes. Fusion Media and any provider of the data contained in this website will not accept liability for any loss or damage as a result of your trading, or your reliance on the information contained within this website.
It is prohibited to use, store, reproduce, display, modify, transmit or distribute the data contained in this website without the explicit prior written permission of Fusion Media and/or the data provider. All intellectual property rights are reserved by the providers and/or the exchange providing the data contained in this website.
Fusion Media may be compensated by the advertisers that appear on the website, based on your interaction with the advertisements or advertisers.