Stocks Rise Despite Tariff Chaos but Technical Patterns Hint at Reversal Ahead
Michael Kramer | May 30, 2025 12:30AM ET
Stocks finished slightly higher on the day, with the S&P 500 up about 40 basis points, nearly half of which came in the final 30 minutes of trading—there was an approximate $3 billion buy imbalance into the close. Given that today is the last trading day of May, some of this activity may be related to month-end rebalancing.
The bigger story yesterday was the ongoing chaos surrounding tariffs. The tariff situation feels never-ending at this point, and it’s unclear how this will ultimately unfold. However, there seems to be a determination to find a path forward. Notably, Section 232 tariffs appear unaffected, meaning pharmaceutical and semiconductor tariffs remain a significant target.
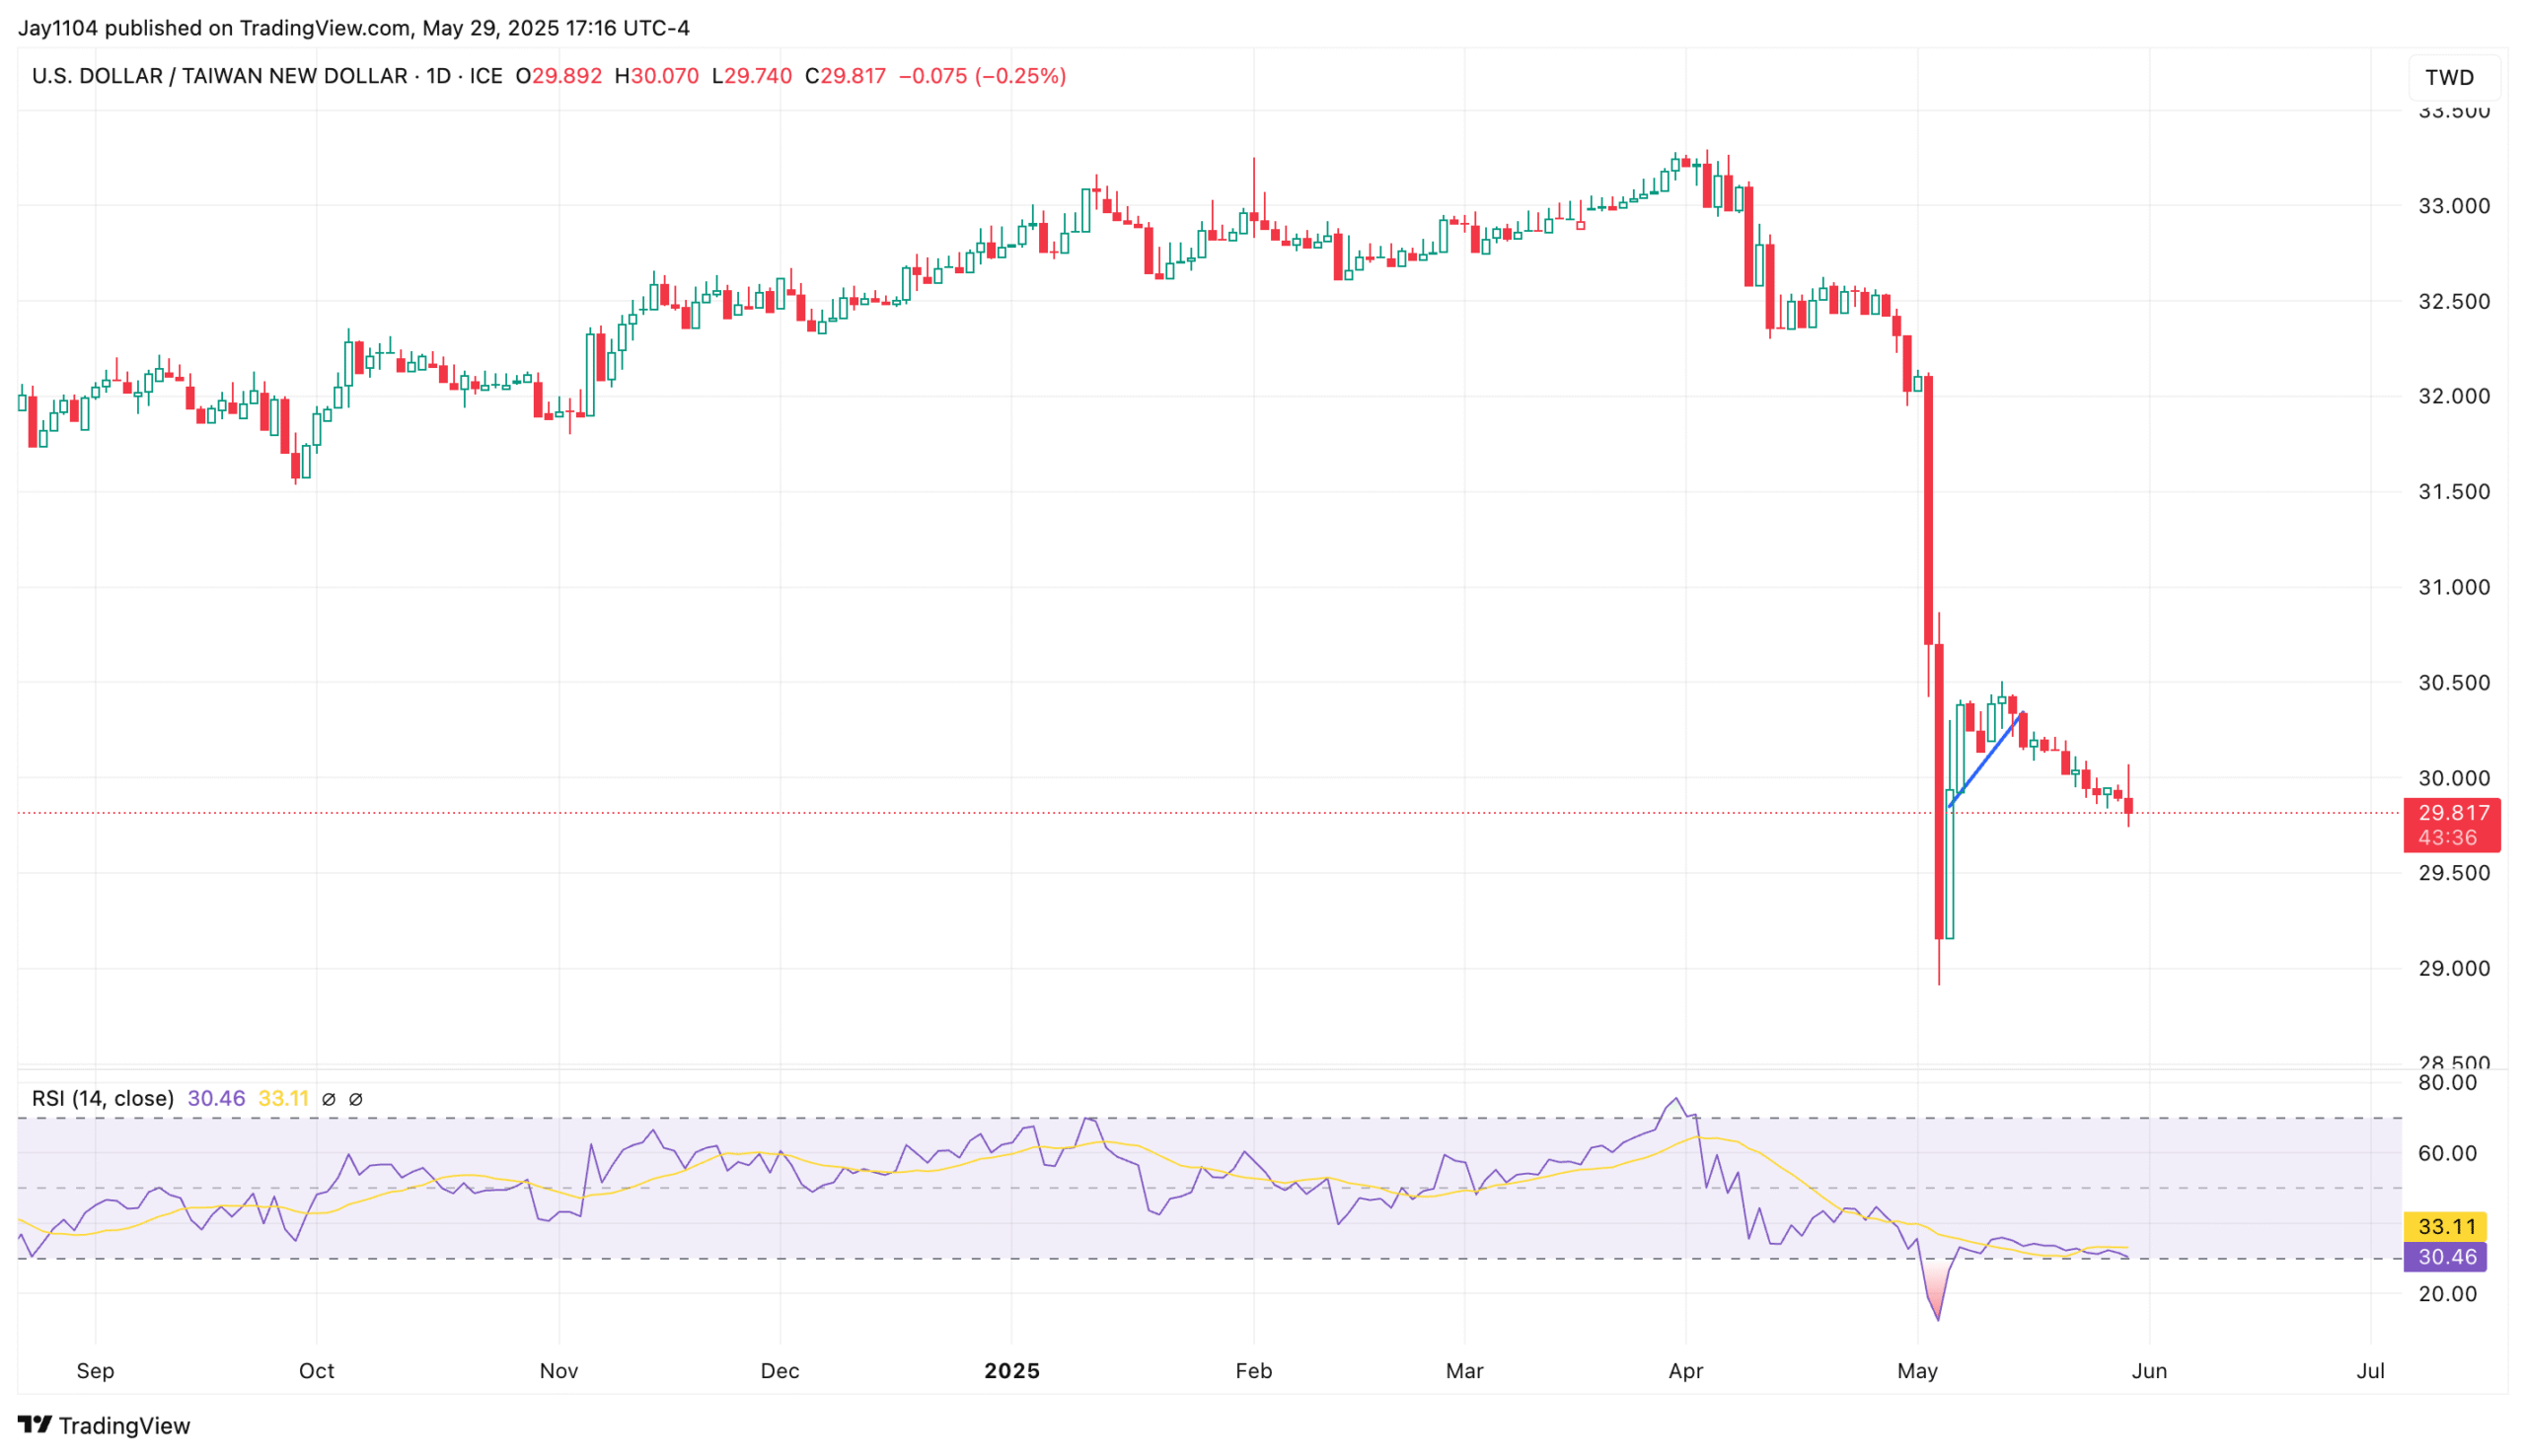
A clear sign that something was wrong with the S&P 500 futures rising following the news was the Taiwan dollar (USD/TWD), which continued to strengthen. The Korean won (USD/KRW) also gained on the day. These two economies are closely linked to semiconductors, and whenever there’s uncertainty around tariffs and trade tensions, movements in these currencies typically reflect sentiment, especially regarding technology
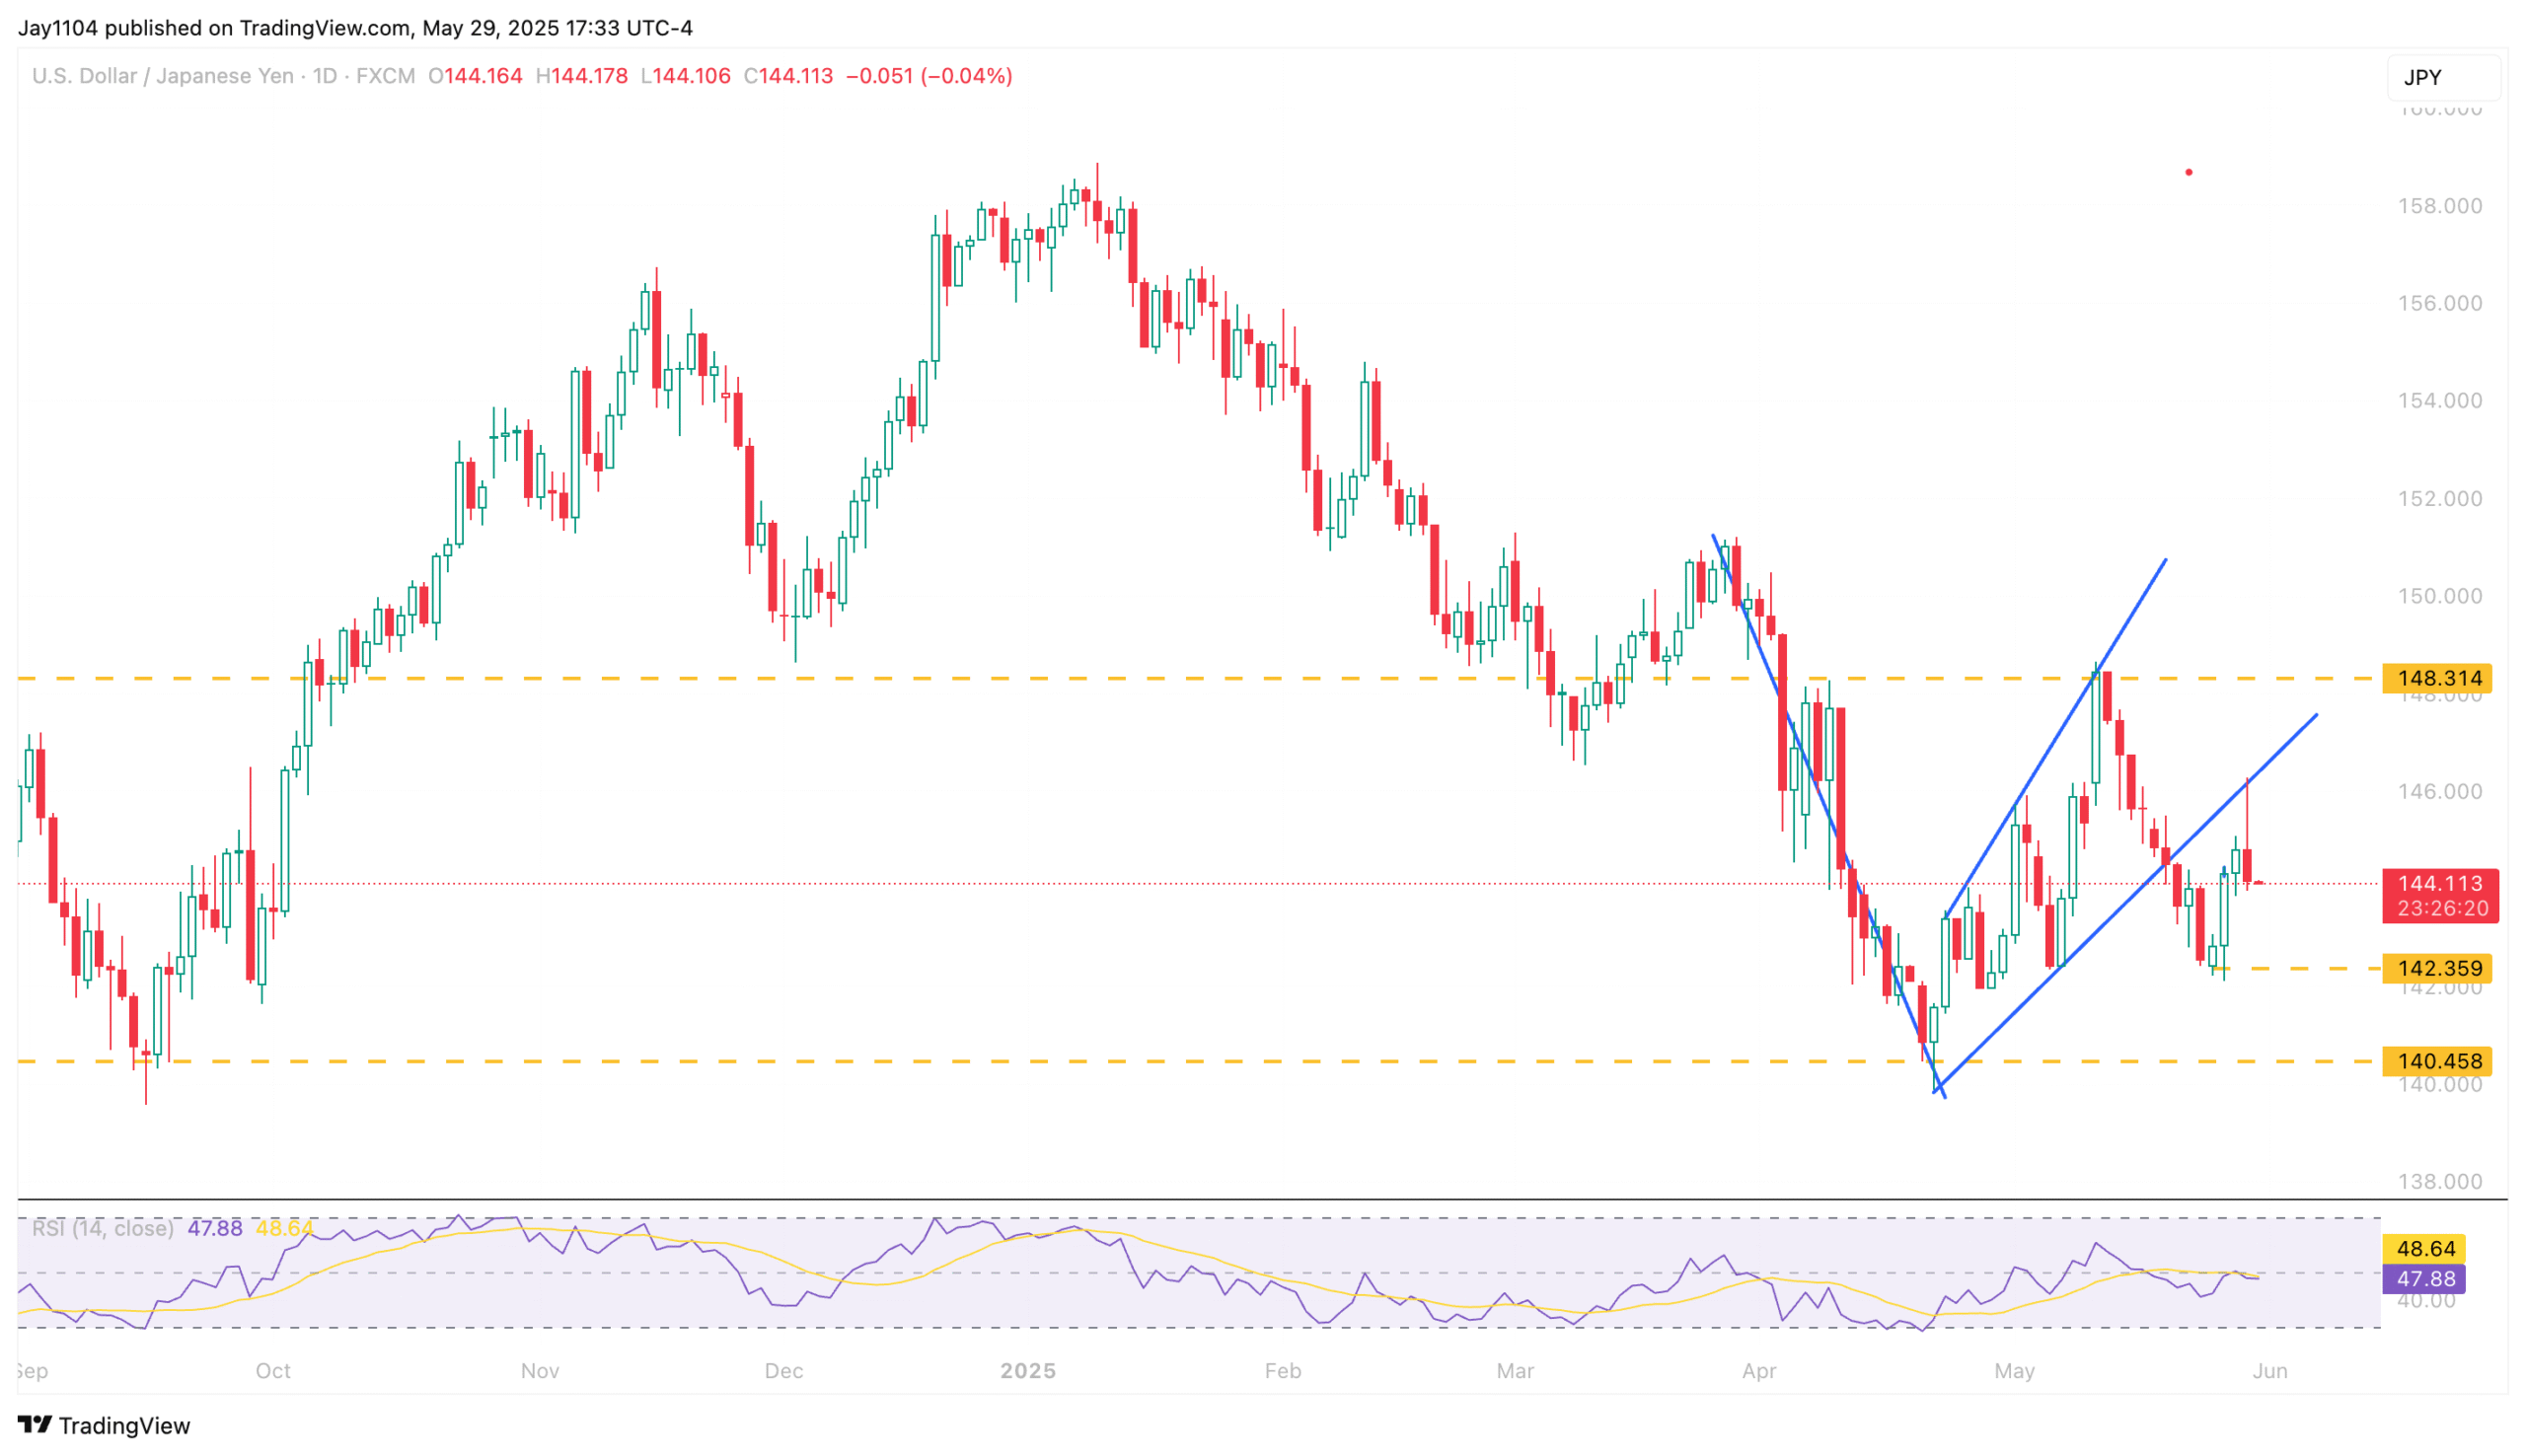
Initially, we saw the yen weaken against the US dollar, but that move reversed around 2 AM. By the end of the day, USD/JPY had strengthened by about 45 basis points.
As for the S&P 500, it initially rose higher in the futures market following the news. However, by the opening, most of those gains had faded, leaving the index trading essentially at yesterday’s highs—and notably, still below last week’s peak.
This creates the potential for a “2B top” pattern in the futures—a reversal formation that occurs when prices attempt to make a new high but ultimately fail to close above the previous high. In this case, the futures attempted to take out the highs on May 19.
I’ll take a bigger-than-usual risk here and stick my neck out—even if it means potentially being embarrassingly wrong. More importantly, though, the pattern forming in the S&P 500 strongly resembles the diamond reversal pattern we saw back in January, indicating a potential reversal might be near. Additionally, one could argue that a head-and-shoulders pattern has also developed.
It is the same setup in the Dow.
The pattern is also present in the S&P 500 Equal Weight ETF (NYSE:RSP).
I’m not sure what the catalyst for a move lower might be—perhaps a hot PCE report today or an irate “Truth” from the President. Oddly enough, the last time he posted on social media was nearly a full day ago, so after being labelled a “TACO” yesterday and dealing with the court orders, he probably isn’t happy. I know I wouldn’t be.
Finally, Nvidia (NASDAQ:NVDA) managed to open above $140 but was unable to maintain those levels. Given yesterday's rejection at the $140 mark, I’ll be interested to see how things unfold today. As I noted last night, we probably wouldn’t fully understand the market’s reaction until yesterday's session concluded—and right now, the path of least resistance appears to be downward.
Original Post
Trading in financial instruments and/or cryptocurrencies involves high risks including the risk of losing some, or all, of your investment amount, and may not be suitable for all investors. Prices of cryptocurrencies are extremely volatile and may be affected by external factors such as financial, regulatory or political events. Trading on margin increases the financial risks.
Before deciding to trade in financial instrument or cryptocurrencies you should be fully informed of the risks and costs associated with trading the financial markets, carefully consider your investment objectives, level of experience, and risk appetite, and seek professional advice where needed.
Fusion Media would like to remind you that the data contained in this website is not necessarily real-time nor accurate. The data and prices on the website are not necessarily provided by any market or exchange, but may be provided by market makers, and so prices may not be accurate and may differ from the actual price at any given market, meaning prices are indicative and not appropriate for trading purposes. Fusion Media and any provider of the data contained in this website will not accept liability for any loss or damage as a result of your trading, or your reliance on the information contained within this website.
It is prohibited to use, store, reproduce, display, modify, transmit or distribute the data contained in this website without the explicit prior written permission of Fusion Media and/or the data provider. All intellectual property rights are reserved by the providers and/or the exchange providing the data contained in this website.
Fusion Media may be compensated by the advertisers that appear on the website, based on your interaction with the advertisements or advertisers.