Stock Market Has Stress Fractures but No Clear Breaks
Michele Schneider | Oct 19, 2023 02:46AM ET
Considering EVERYTHING:
- Yields and mortgage rates
- War
- Inflation and rising commodity prices
- Bank stocks falling
- Risk Gauges 2 out of 6 now risk-off
To name a few, why then is the S&P 500 so strong?
Here are a few reasons:
- Fed members suggest rate hike pauses.
- Hope that the war lateralizes rather than escalates.
- Economy stats mixed with retail sales and labor strong.
- Sidelined cash in money markets could move into equities.
- Seasonally, Q4 and pre-election years are historically strong.
Besides the SPY chart, we are also watching the price in small caps.
I feel like I have written the same themes repeatedly. It’s almost like a mantra:
- Watch price and timeframe in the economic modern family
- Watch commodities
- Watch risk gauges
And here we are still stuck in time as time seemingly stands still amidst the increasingly faster speed and plethora of news.
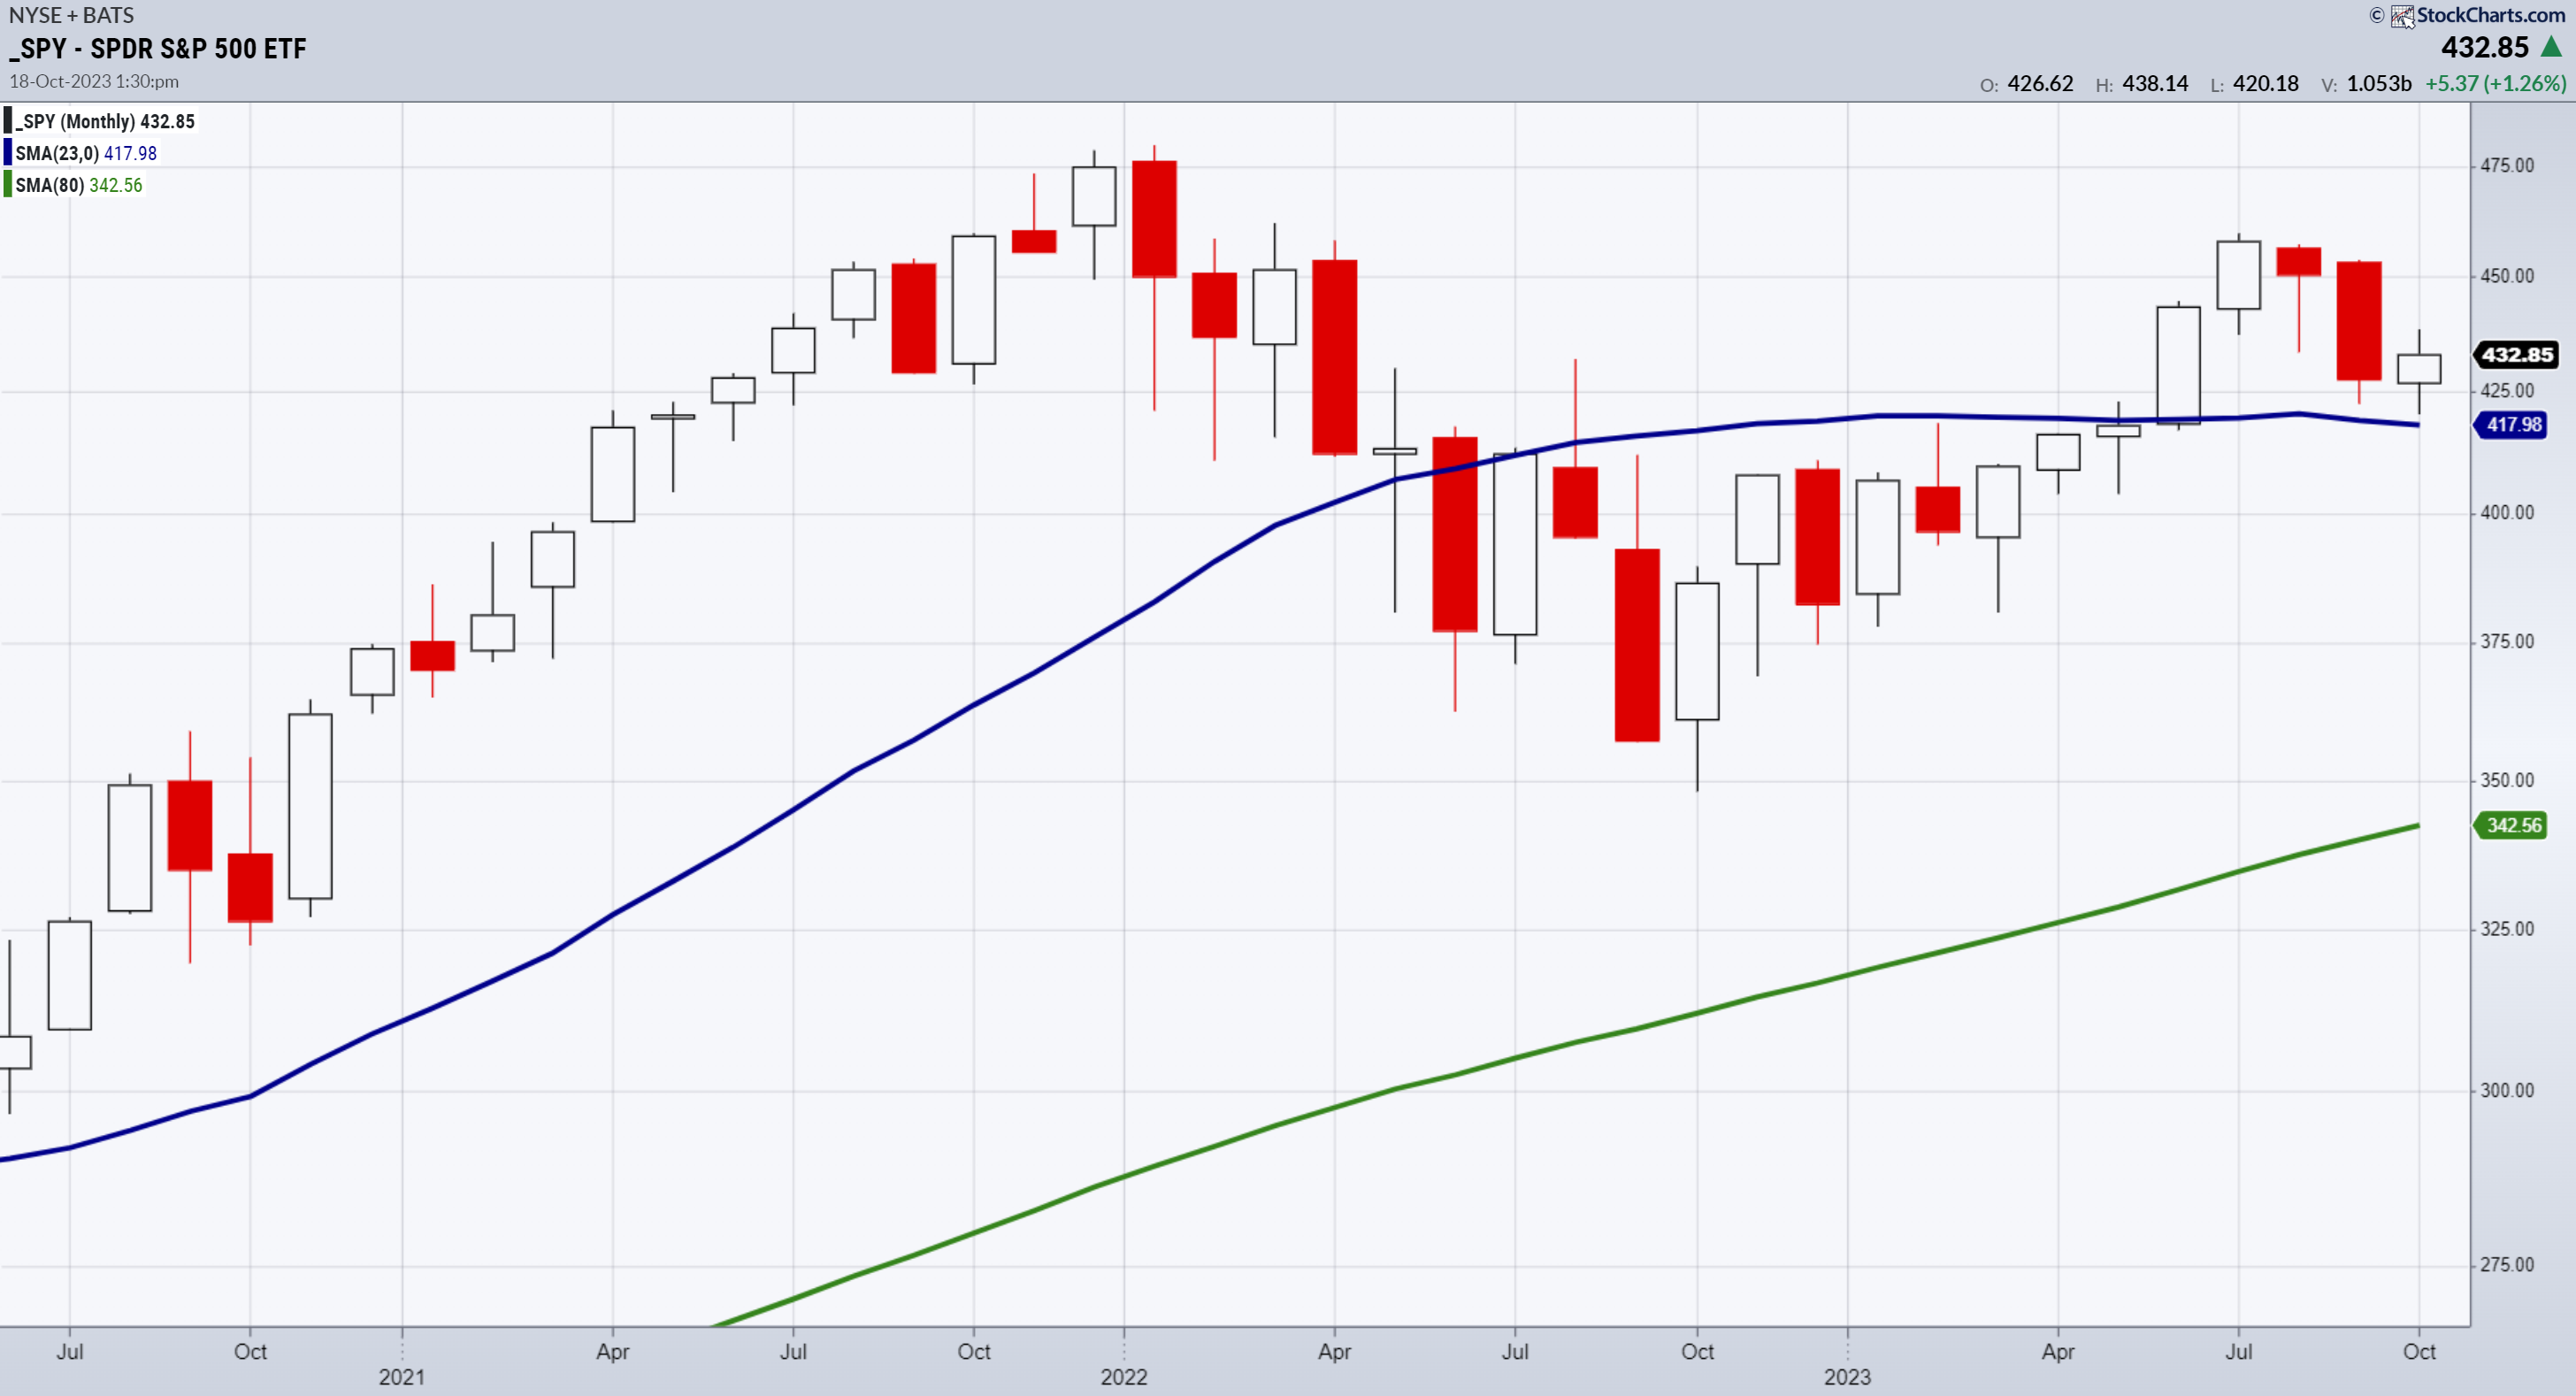
The SPY monthly chart is not bearish.
It could turn out that way, but presently, SPY sits atop the blue line or 23-month moving average.
We have 2 weeks left in October, so we are watching the 418 level carefully.
We are also watching 450 as resistance carefully.
After all, a trading range is not only possible but also plausible.
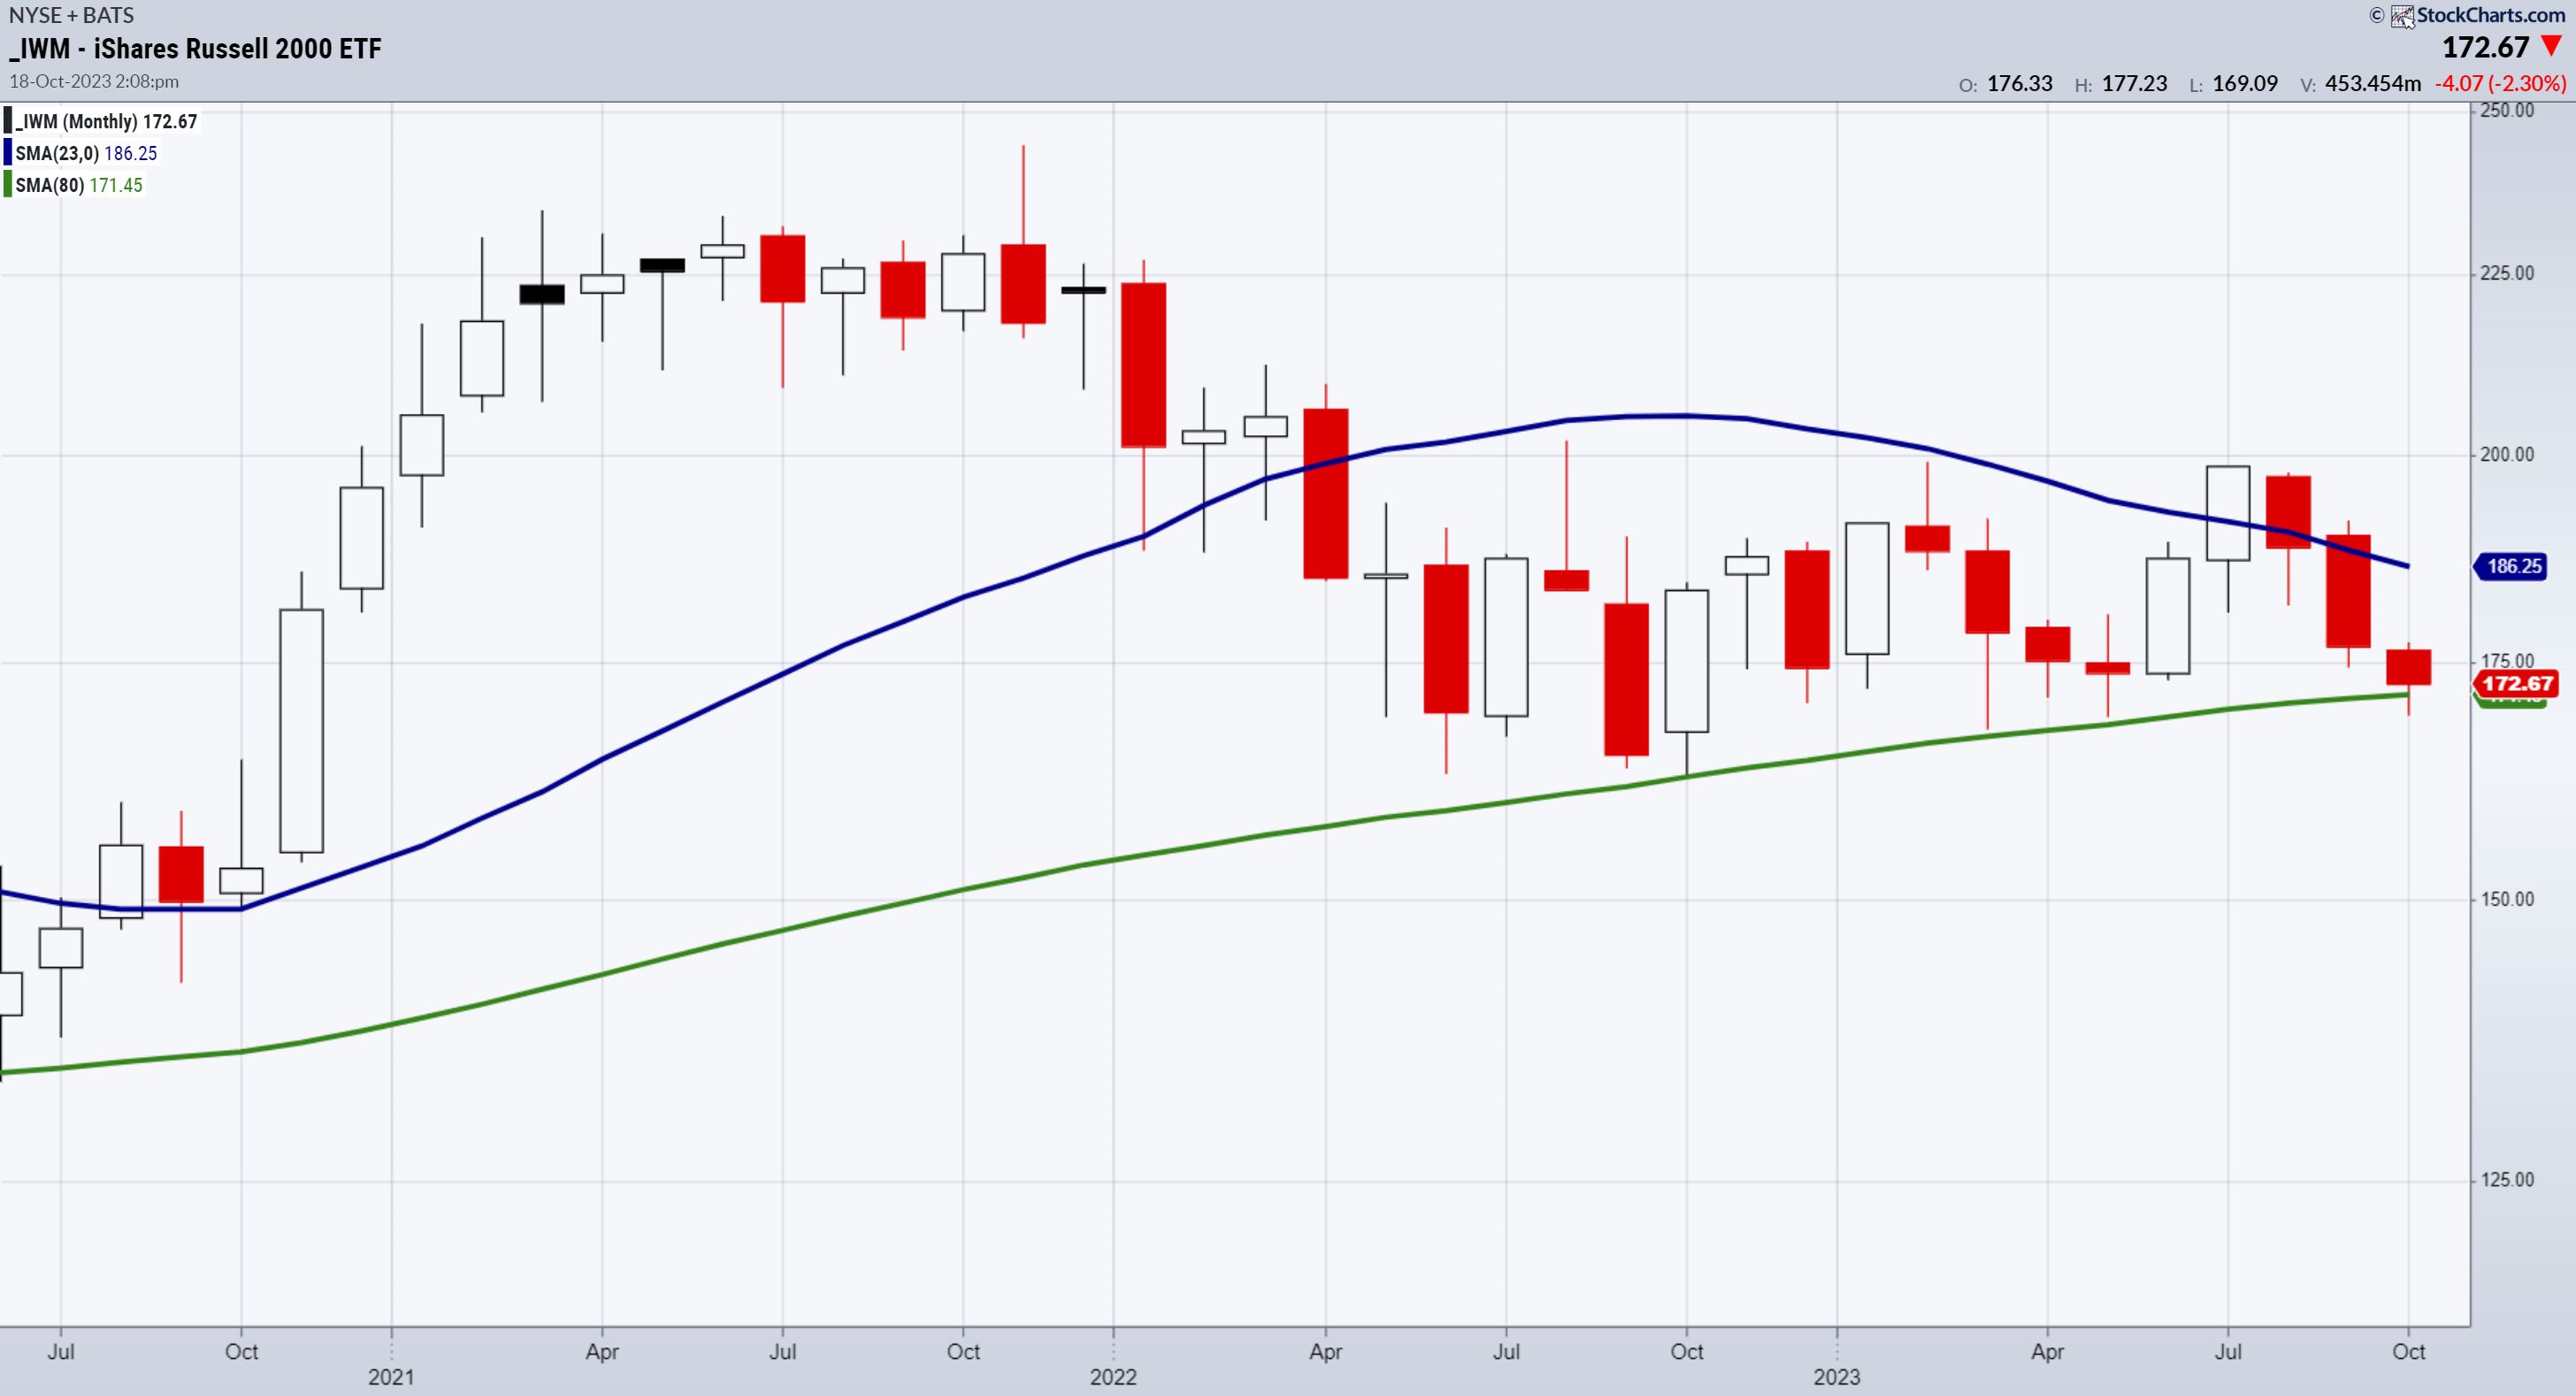
Small caps look more vulnerable.
Hence, we look to them to tell us what’s next.
Negatives:
A declining slope on the 23-month MA
A narrowing between the 23 and 80-month MAs
An unimpressive bounce off the 80-month MA (green line).
Positives:
(IWM) is still above the 80-month MA
His wife, Granny Retail XRT is potentially making triple bottoms off of the October 2022 lows.
Tune out the noise and follow the charts.
ETF Summary
- S&P 500 (SPY) 440 resistance 429 support
- Russell 2000 (IWM) 177 resistance 170 KEY support
- Dow (DIA) 344 resistance 332 support
- Nasdaq (QQQ) 368 resistance 363 support
- Regional banks (KRE) 39.80 -42.00 range
- Semiconductors (SMH) 150 resistance 140 support
- Transportation (IYT) 237 resistance 225 support
- Biotechnology (IBB) 120-125 range
- Retail (XRT) 57 key support if can climb over 62, better
Trading in financial instruments and/or cryptocurrencies involves high risks including the risk of losing some, or all, of your investment amount, and may not be suitable for all investors. Prices of cryptocurrencies are extremely volatile and may be affected by external factors such as financial, regulatory or political events. Trading on margin increases the financial risks.
Before deciding to trade in financial instrument or cryptocurrencies you should be fully informed of the risks and costs associated with trading the financial markets, carefully consider your investment objectives, level of experience, and risk appetite, and seek professional advice where needed.
Fusion Media would like to remind you that the data contained in this website is not necessarily real-time nor accurate. The data and prices on the website are not necessarily provided by any market or exchange, but may be provided by market makers, and so prices may not be accurate and may differ from the actual price at any given market, meaning prices are indicative and not appropriate for trading purposes. Fusion Media and any provider of the data contained in this website will not accept liability for any loss or damage as a result of your trading, or your reliance on the information contained within this website.
It is prohibited to use, store, reproduce, display, modify, transmit or distribute the data contained in this website without the explicit prior written permission of Fusion Media and/or the data provider. All intellectual property rights are reserved by the providers and/or the exchange providing the data contained in this website.
Fusion Media may be compensated by the advertisers that appear on the website, based on your interaction with the advertisements or advertisers.