SPY May Have Reached Its Summer High
Trading On The Mark | Jun 05, 2020 12:14PM ET
The major U.S. stock indices continue to rally, and many of them show what appear to be impulsive formations out of the scary spring lows. This week we examine the SPDR S&P 500 ETF Trust (ASX:SPY), which follows the index closely.
Readers will recall that we are treating the price action in most of the indices from late 2018 into early 2020 as large fourth-wave corrections. In that scenario, we would expect some type of motive pattern to emerge and eventually take prices to new highs in wave [v]. The first leg (i) of the motive pattern should be an Elliott wave impulse, or five-wave structure.
The rally since the March 23 low has been quite steep, but the expected five-wave structure is visible on a daily chart (not shown here). We count it as nearly complete as it approaches an area of potential resistance that we derive from weekly and monthly charts.
On the weekly chart of SPY (NYSE:SPY) shown below, much of the action within wave [iv] has recognized the elements of an upward-sloping channel. The imminent test of the main upper boundary would make the 313 area an attractive cap for wave (i).
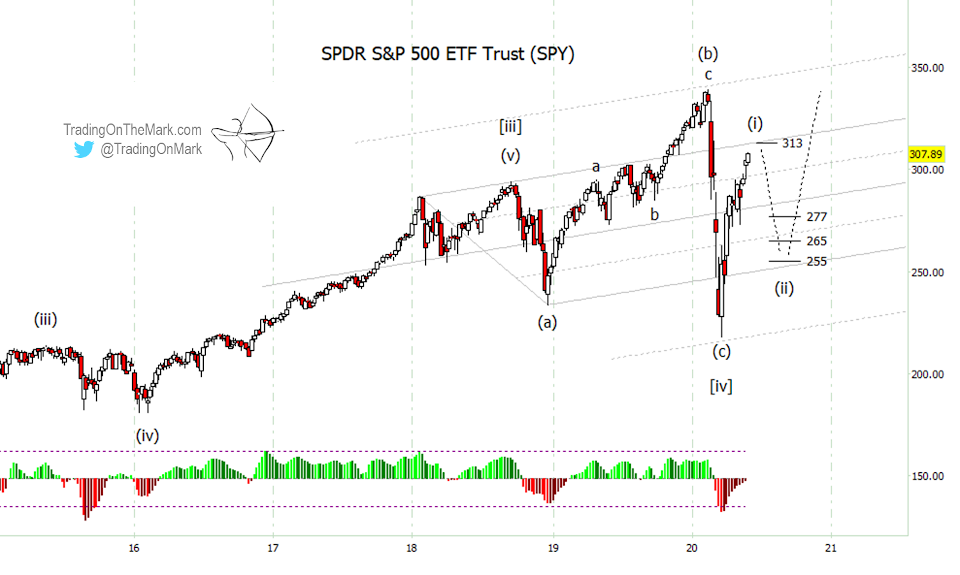
If SPY retreats from the 313 area, then typical Fibonacci retracement supports would await at 277, 265 and 255. The lowest of those supports might coincide with a test of the other main channel boundary later this year. We have additional reasons to watch the 313 area for a reversal in SPY. Note that the adaptive CCI momentum indicator is on the verge of testing its zero line – an event that often coincides with a reversal of some magnitude.
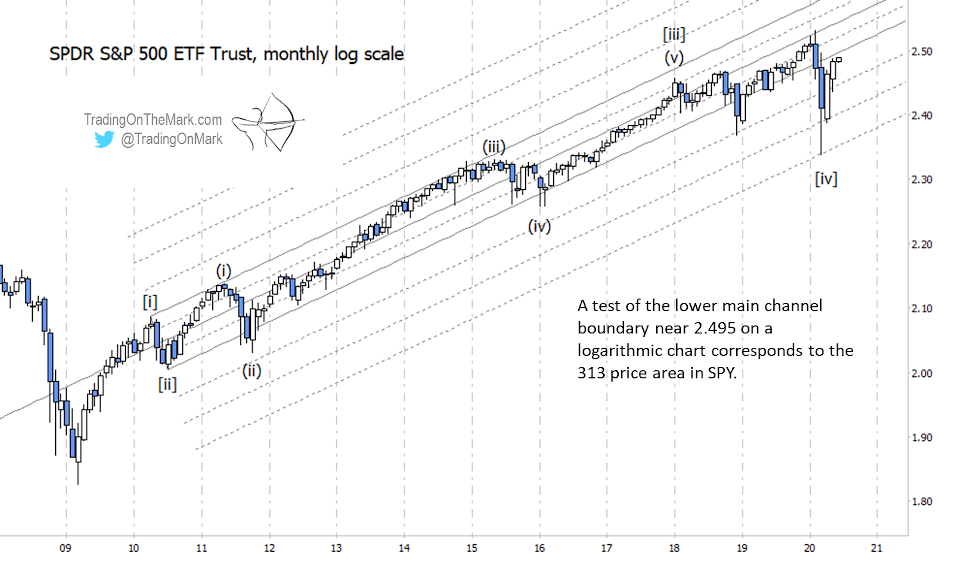
There’s also a long-running channel we’ve been watching on a monthly logarithmic chart (above) that puts a boundary test in the 313 price area (approximately 2.495 on the base 10 log scale). We believe price can move back into the main channel area eventually, but it probably will need to put in a retreat first.
Trading in financial instruments and/or cryptocurrencies involves high risks including the risk of losing some, or all, of your investment amount, and may not be suitable for all investors. Prices of cryptocurrencies are extremely volatile and may be affected by external factors such as financial, regulatory or political events. Trading on margin increases the financial risks.
Before deciding to trade in financial instrument or cryptocurrencies you should be fully informed of the risks and costs associated with trading the financial markets, carefully consider your investment objectives, level of experience, and risk appetite, and seek professional advice where needed.
Fusion Media would like to remind you that the data contained in this website is not necessarily real-time nor accurate. The data and prices on the website are not necessarily provided by any market or exchange, but may be provided by market makers, and so prices may not be accurate and may differ from the actual price at any given market, meaning prices are indicative and not appropriate for trading purposes. Fusion Media and any provider of the data contained in this website will not accept liability for any loss or damage as a result of your trading, or your reliance on the information contained within this website.
It is prohibited to use, store, reproduce, display, modify, transmit or distribute the data contained in this website without the explicit prior written permission of Fusion Media and/or the data provider. All intellectual property rights are reserved by the providers and/or the exchange providing the data contained in this website.
Fusion Media may be compensated by the advertisers that appear on the website, based on your interaction with the advertisements or advertisers.