S&P500: Does Recent Surge In Breadth Signal New Secular Bull?
Dr. Arnout ter Schure | Feb 17, 2021 06:36PM ET
One way to measure market breadth is to look at how many stocks in a particular index are above their 50-day Simple Moving Average or even above their 200-day SMA. Namely, the more there are, the stronger the market is because it is still a "market of stocks."
For the S&P 500, these two indicators are called the SPXA50R and SPXA200R. Individually they give a good idea if a market rally is strong (high readings) or weak (low readings).
Besides, one can also express market breadth as a ratio of the two: A50R/A200R. Namely, after a low in the index, the number of stocks rallying back above the faster responding 50-day SMA often outpaces those stocks rallying above the -slower responding- 200d SMA. Thus significant lows are hallmarked by big spikes in the ratio. I have data available for this ratio since 2002, so let us look at recent spikes. See figure 1 below.
Figure 1. S&P500 with the A50R/A200R ratio.
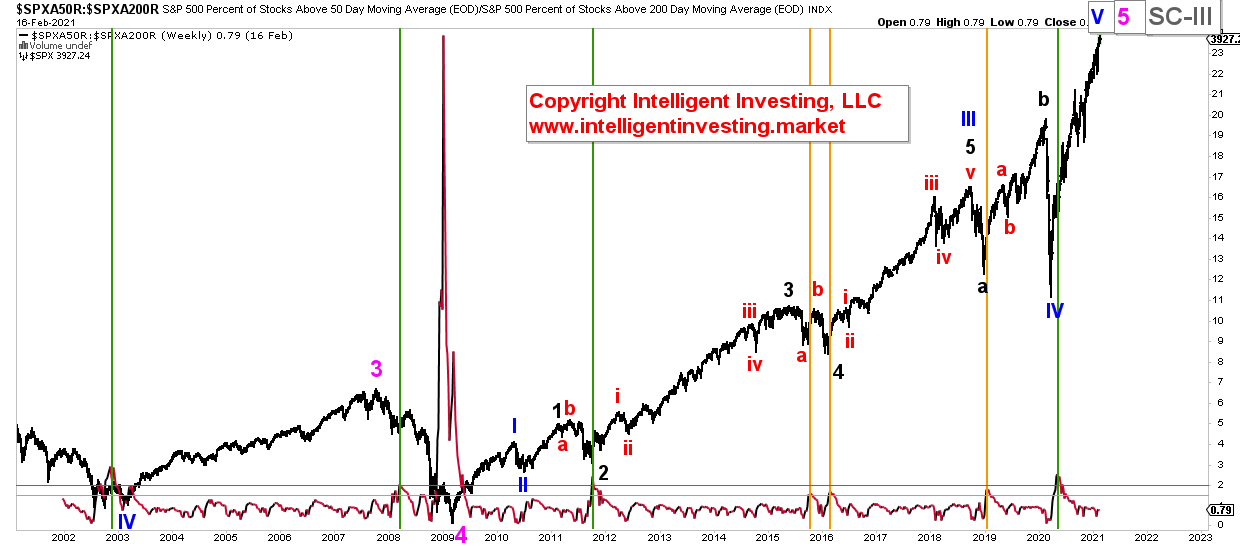
The spike-high in 2009 sticks out as a sour thumb, so let us not focus on it yet. Based on my long-term Elliott Wave Principle count, that was a (purple) Cycle-4 degree low. Ever since, the SPX has, in my opinion, been in Cycle-5 and is getting closer and closer to wrapping this large wave up to complete (grey) Super Cycle-III. A wave of the same degree as the 1929 top.
The ratio's long-term average is around 0.9, and I defined ratio spikes when above 1.5 (orange) and 2 (green). These high ratios happened only in 2002, 2008, 2011, 2015, 2016, 2019 and 2020. The 2002 reading was 2.94, and the SPX started (blue) Primary-V of Cycle-3. The 2008 spike was 2.04 and marked only a short-term relief bounce in a bear market. The 2011 peak was 2.42, and the index started (black) major-3 of primary-III. The 2015 spike was 1.6 and marked only a short-term relief bounce in a more extensive correction. The 2016 peak was 1.7, and the market started major-5 of Primary-III. The 2019 spike was 1.8 and marked the start of a massive b-wave of Primary-IV. The 2020 peak was 2.56, and the market started Primary-V of Cycle-5.
Thus, excluding the 2009 spike, with three prior readings >2.0, there were two multi-year bull runs (2003 -> 2007, 2011 -> 2015) and only one bear market rally (2008). Odds thus favored a bull run from the 2020 spike, which we got and are still experiencing. The preferred EWP count for the current rally supports this finding. Thus, the 2020 low was, based on the A50R/A200R ratio, most likely not the start of a decadal bull market like 2009, but the beginning of a multi-year bull market.
Bottom line: Although limited data is available, surges in market breadth most often signal multi-year bull markets. However, not every surge is equal and needs to be placed in its proper perspective. The EWP could help us better understand this perspective, i.e., if a recent surge in the breadth was the start of a decades long-party or only part of a fest that had already started. In this case, the breadth surge off the 2020 low is similar to prior multi-year rallies and not that of a decadal low. My long-term EWP count supports this thesis. Hence, the SPX is currently in its final rally since the March 2009 low, and likely even since the July 1932 low.
![]()
Trading in financial instruments and/or cryptocurrencies involves high risks including the risk of losing some, or all, of your investment amount, and may not be suitable for all investors. Prices of cryptocurrencies are extremely volatile and may be affected by external factors such as financial, regulatory or political events. Trading on margin increases the financial risks.
Before deciding to trade in financial instrument or cryptocurrencies you should be fully informed of the risks and costs associated with trading the financial markets, carefully consider your investment objectives, level of experience, and risk appetite, and seek professional advice where needed.
Fusion Media would like to remind you that the data contained in this website is not necessarily real-time nor accurate. The data and prices on the website are not necessarily provided by any market or exchange, but may be provided by market makers, and so prices may not be accurate and may differ from the actual price at any given market, meaning prices are indicative and not appropriate for trading purposes. Fusion Media and any provider of the data contained in this website will not accept liability for any loss or damage as a result of your trading, or your reliance on the information contained within this website.
It is prohibited to use, store, reproduce, display, modify, transmit or distribute the data contained in this website without the explicit prior written permission of Fusion Media and/or the data provider. All intellectual property rights are reserved by the providers and/or the exchange providing the data contained in this website.
Fusion Media may be compensated by the advertisers that appear on the website, based on your interaction with the advertisements or advertisers.