S&P500: A Look At Short-Term Elliott Wave Count
Dr. Arnout ter Schure | Dec 08, 2020 02:42PM ET
Over the past several weeks, I kept you informed about how the S&P 500 was setting up. Now, it is most likely on its way to SPX 4000+. Last week it bumped into SPX 3675 resistance four times, red arrows in Figure 1, but managed to break above it on Friday. What once was resistance may now act as support, and the index has retested the SPX 3675 zone three times already this week (green arrows). So far, it is holding, and as long as it does, we can expect SPX 3715+/-5p next.
Why?
That is the simple symmetry breakout target (blue dotted arrows), just like the breakout above SPX 3595 and successful retest thereof lead to the rally to SPX 3645+/-5P (purple dotted arrows).
Figure 1:
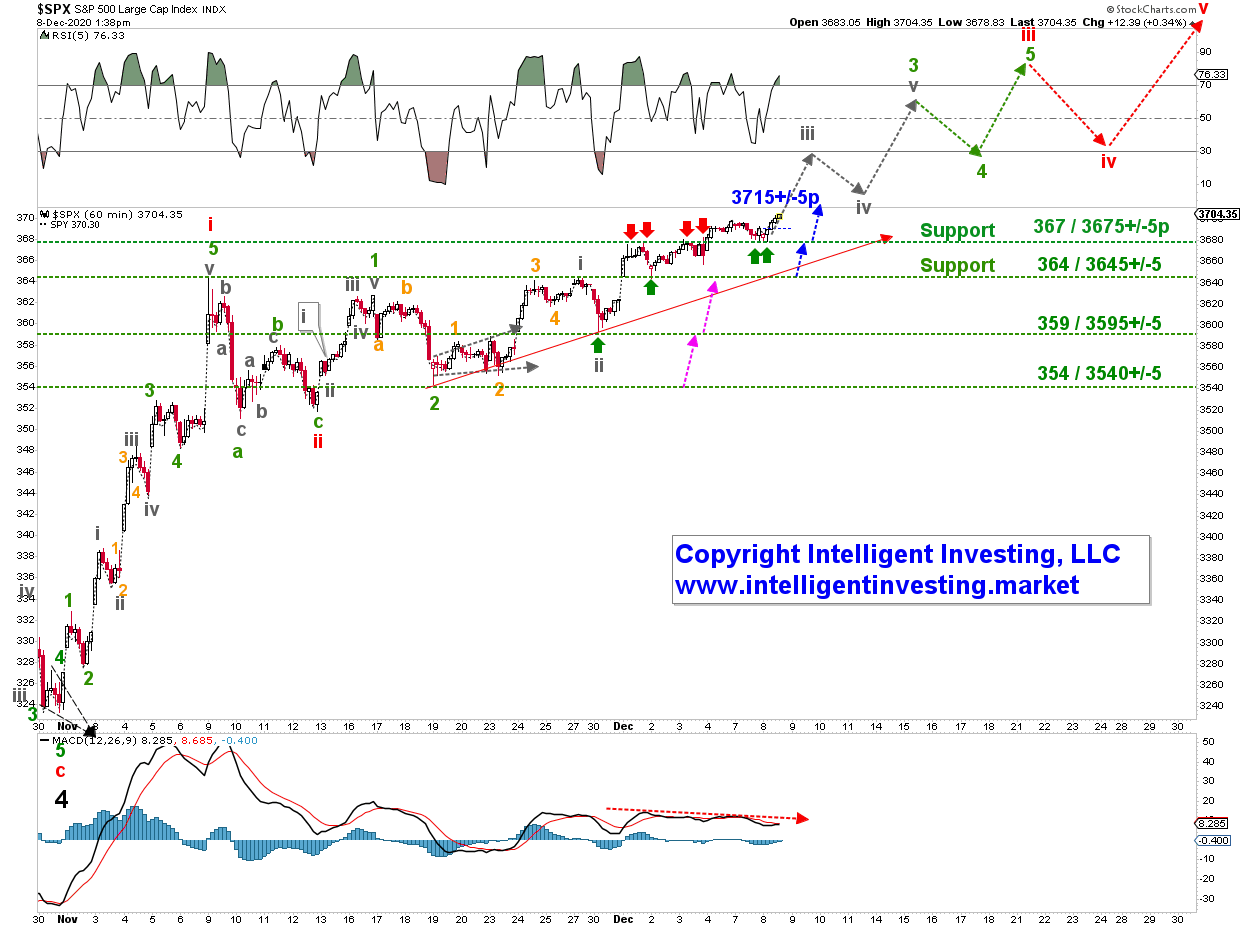
This “stair-stepping” behavior is normal bull-market behavior: breakout, retest the breakout successfully, move higher to the next symmetry/Fibonacci-based price-level. Thus, the bears were unable to close the index below SPX 3640 (see last week’s article here) and, therefore, we can now move those “watch-out-below“ levels up by one step to SPX 3675 and SPX 3645. As a trader, one can, for example, move up stops on any index-related long positions accordingly.
Besides, the grey, green and red arrows show the preferred Elliot wave principle (EWP)-based path as we advance (not accurate in price and time). The index bottomed late-October for (black) major wave-4 and is now in major wave-5, which consists of five smaller waves: (Red) intermediate waves i, ii, iii, iv, v. So far, only (red) waves i and ii completed. Intermediate wave-iii is now, ideally and preferably, under way as long as the support levels mentioned above hold.
Since markets are fractal in nature, this red intermediate wave-iii is made up of five smaller waves: (green) minor waves 1, 2, 3, 4, 5. Etc. Based on my internal waves assessments, the index is now in (grey) minute-iii of minor-3 of intermediate-iii of major-5. The grey, green and red dotted arrows show the ideal path going forward to complete major-5, which is the last larger wave up from the March low struck this year. It should end in the spring of 2021 at around SPX 4000-4200. After that, we should see a very sizable correction.
![]()
Trading in financial instruments and/or cryptocurrencies involves high risks including the risk of losing some, or all, of your investment amount, and may not be suitable for all investors. Prices of cryptocurrencies are extremely volatile and may be affected by external factors such as financial, regulatory or political events. Trading on margin increases the financial risks.
Before deciding to trade in financial instrument or cryptocurrencies you should be fully informed of the risks and costs associated with trading the financial markets, carefully consider your investment objectives, level of experience, and risk appetite, and seek professional advice where needed.
Fusion Media would like to remind you that the data contained in this website is not necessarily real-time nor accurate. The data and prices on the website are not necessarily provided by any market or exchange, but may be provided by market makers, and so prices may not be accurate and may differ from the actual price at any given market, meaning prices are indicative and not appropriate for trading purposes. Fusion Media and any provider of the data contained in this website will not accept liability for any loss or damage as a result of your trading, or your reliance on the information contained within this website.
It is prohibited to use, store, reproduce, display, modify, transmit or distribute the data contained in this website without the explicit prior written permission of Fusion Media and/or the data provider. All intellectual property rights are reserved by the providers and/or the exchange providing the data contained in this website.
Fusion Media may be compensated by the advertisers that appear on the website, based on your interaction with the advertisements or advertisers.