S&P Q3 Wrap-Up And Q4 Outlook
Candy Matheson | Oct 03, 2022 12:58AM ET
Further to my posts of Sept. 30 and Sept. 24, the following will summarize SPX market action for the month of September, Q3 and year-to-date.
Please refer to the following three charts...namely, the yearly, quarterly and monthly timeframes for the SPX.
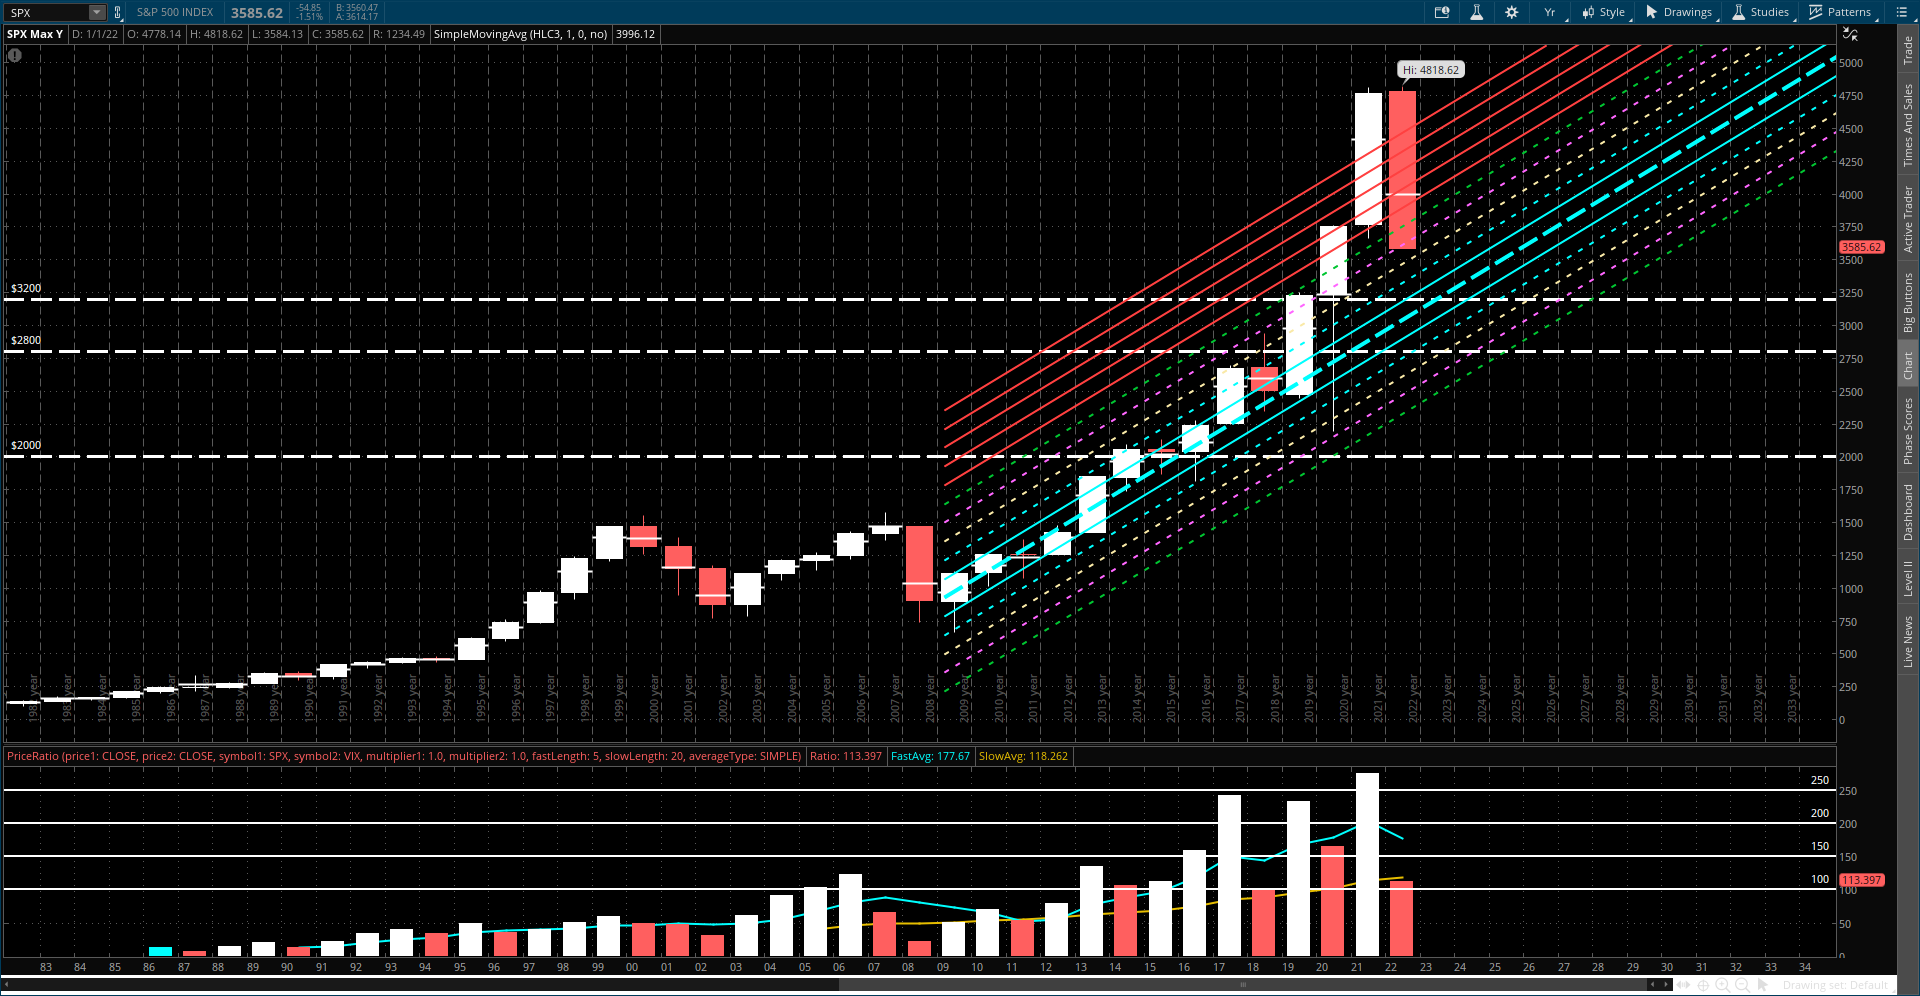
Yearly Timeframe
A bearish engulfing candle has formed, so far, this year on the S&P 500 yearly chart, and it has a range of 1,234.49 points...the second largest on record, after the 2020 range. It closed at a new low in 2022 and well below its yearly pivot point of 3996.12.
The SPX:VIX ratio, shown at the bottom of the chart in histogram form, is sitting just above an important major support level of 100.00, and has fallen below both 5 and 20-year MAs...depicting extreme bearishness on this timeframe.
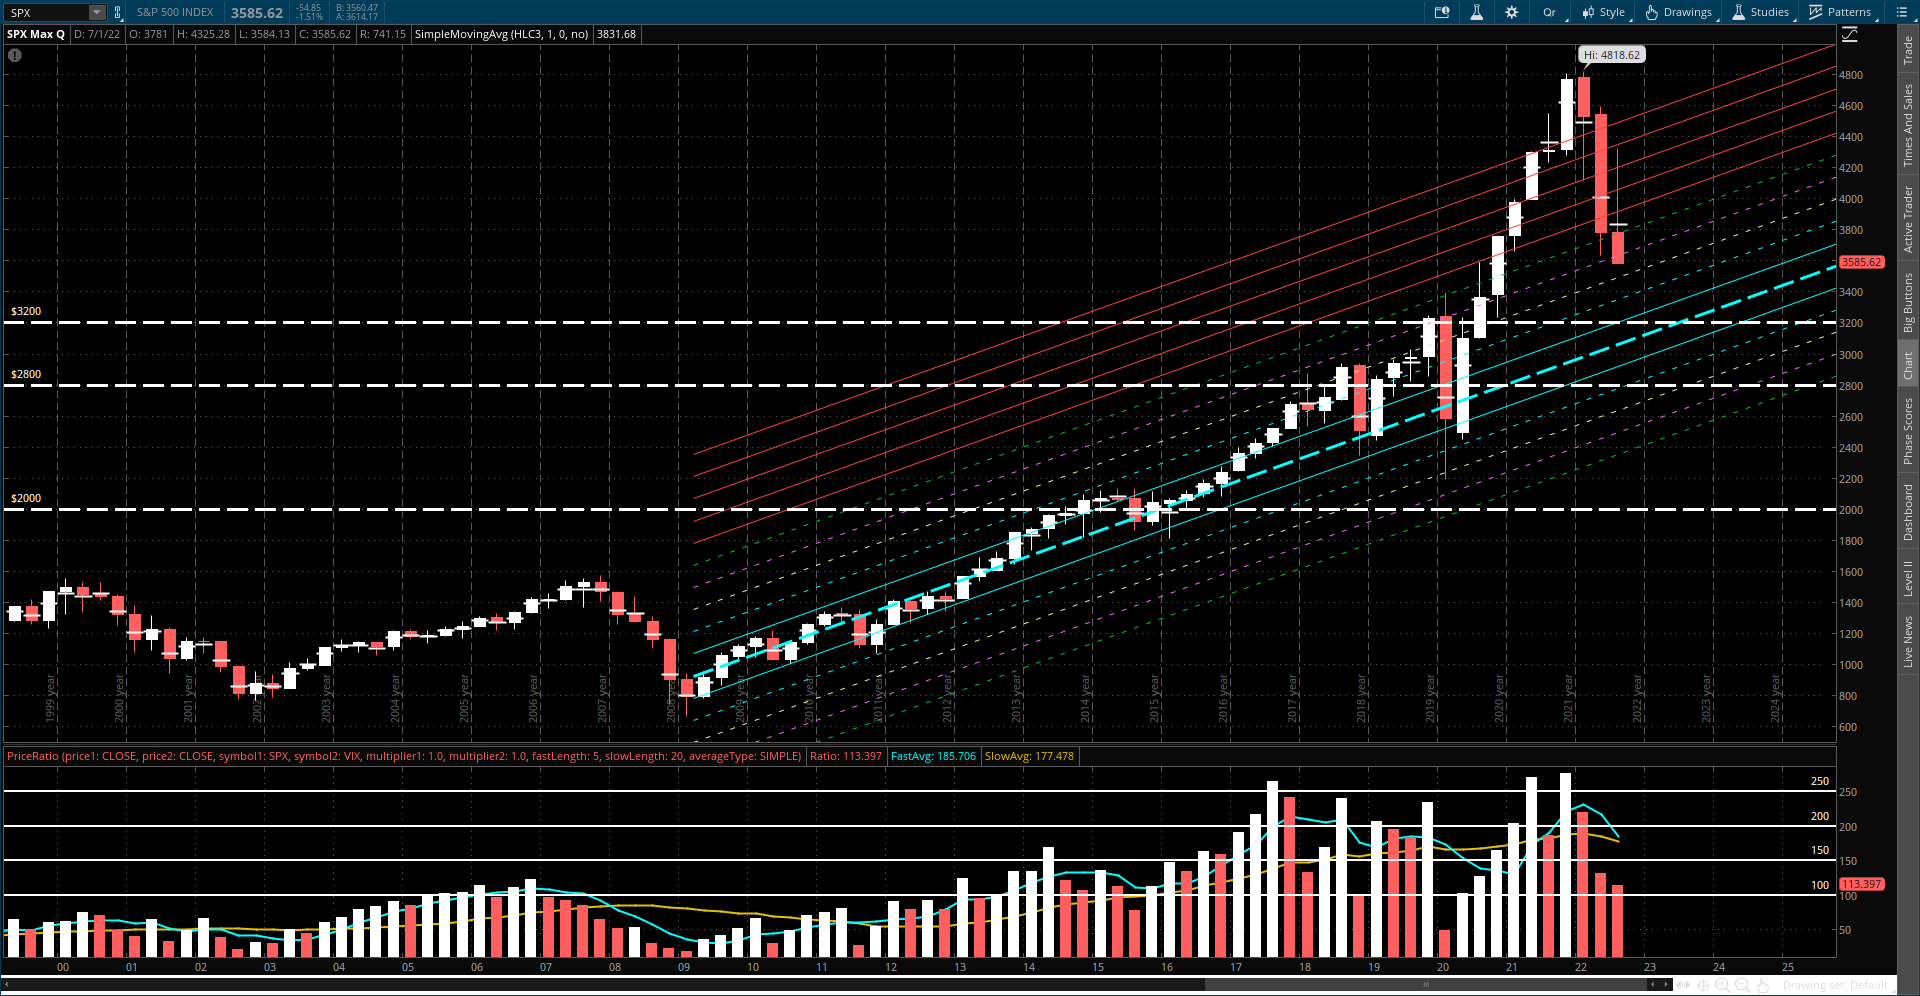
Quarterly Timeframe
Note the long upper spike on the Q3 candle, where it faked a bullish reversal, before falling to a new quarterly low close for 2022...and well below its quarterly pivot point of 3831.68.
The SPX:VIX ratio, shown at the bottom of the chart in histogram form, is sitting just above an important major support level of 100.00, and has fallen well below both 5 and 20-quarter MAs (which are about to form another bearish crossover)...depicting extreme bearishness on this timeframe.
Monthly Timeframe
Note the long upper spike on the September candle, where it faked a bullish reversal, before plunging and closing at a new low for 2022...and well below its monthly pivot point of 3763.01.
The SPX:VIX ratio, shown at the bottom of the chart in histogram form, is sitting just above an important major support level of 100.00, and has fallen well below both 5 and 20-monthly MAs (which formed another bearish crossover in April)...depicting extreme bearishness on this timeframe.
Pivot Points For October
The following Pivot Point Calculator depicts the Pivot Point, 3 Resistance Levels, and 3 Support Levels for the month of October (taken from the data of the September candle)...which are possible upside and downside targets.
Note that the S2 target is in line with the first major support level of 3200, mentioned in my post of September 30, while S3 sits just above the next major support level of 2800, also mentioned therein.
Conclusions
- Until we see the SPX:VIX ratio fall to somewhere around 80.00, or more likely 60.00, I don't think we're close to an equity capitulation, yet.
- Furthermore, and, as I concluded in my post of September 24, all in all, I see no pivot away from U.S. Dollar strength and global equity and sector (and Bitcoin) weakness...Yet.
- So, for the moment, U.S. cash is king, as the inflation has declined to the Fed's 2% maximum inflation target...which could last well into 2025.
- As an aside, my 2021 Market Wrap-Up and 2022 Forecast (written on January 1) has been fairly accurate, to date. By the way, the S2 target for the 2022 timeframe (calculated from the 2021 candle) is close to 3200 (and the Pivot Point from the 2020 candle sits at 3236.04), while the S3 target is close to 2800...both of which are likely targets, either for October, or sometime this year...especially 3200, where there is a confluence of a variety of Pivot Point targets, as well as (first) major price support. Here are several excerpts from that post, as well as my last update therein...
Finally, until President Biden drastically changes course from his 'Big Government Tax & Spend' agenda, and unleashes the oil and gas industry by dropping his overly-restrictive and punitive regulations, trade with caution, as I expect high volatility and large intraday swings to continue!
Trading in financial instruments and/or cryptocurrencies involves high risks including the risk of losing some, or all, of your investment amount, and may not be suitable for all investors. Prices of cryptocurrencies are extremely volatile and may be affected by external factors such as financial, regulatory or political events. Trading on margin increases the financial risks.
Before deciding to trade in financial instrument or cryptocurrencies you should be fully informed of the risks and costs associated with trading the financial markets, carefully consider your investment objectives, level of experience, and risk appetite, and seek professional advice where needed.
Fusion Media would like to remind you that the data contained in this website is not necessarily real-time nor accurate. The data and prices on the website are not necessarily provided by any market or exchange, but may be provided by market makers, and so prices may not be accurate and may differ from the actual price at any given market, meaning prices are indicative and not appropriate for trading purposes. Fusion Media and any provider of the data contained in this website will not accept liability for any loss or damage as a result of your trading, or your reliance on the information contained within this website.
It is prohibited to use, store, reproduce, display, modify, transmit or distribute the data contained in this website without the explicit prior written permission of Fusion Media and/or the data provider. All intellectual property rights are reserved by the providers and/or the exchange providing the data contained in this website.
Fusion Media may be compensated by the advertisers that appear on the website, based on your interaction with the advertisements or advertisers.