S&P E-Mini Futures Intraday Targets For Feb. 24, 2020
Candy Matheson | Feb 24, 2020 04:03AM ET
It's around 12:30 am ET on Monday as I begin to write this post. All four U.S. E-mini Futures Indices have gapped down substantially from Friday's close, as shown on the following daily charts of YM, ES, NQ and RTY.
The ES is hovering above its 50-day MA (3279), while the NQ is still well above, and the YM and RTY are below their respective MA.
All of them are trading either within or below a "chaos zone" of a trio of future-offset 5, 8 and 13 moving averages (green, red and blue). Until they all break and hold above this entire zone, I forecast further volatility and/or weakness for U.S. equities. The downturn in these three moving averages is hinting of further weakness.
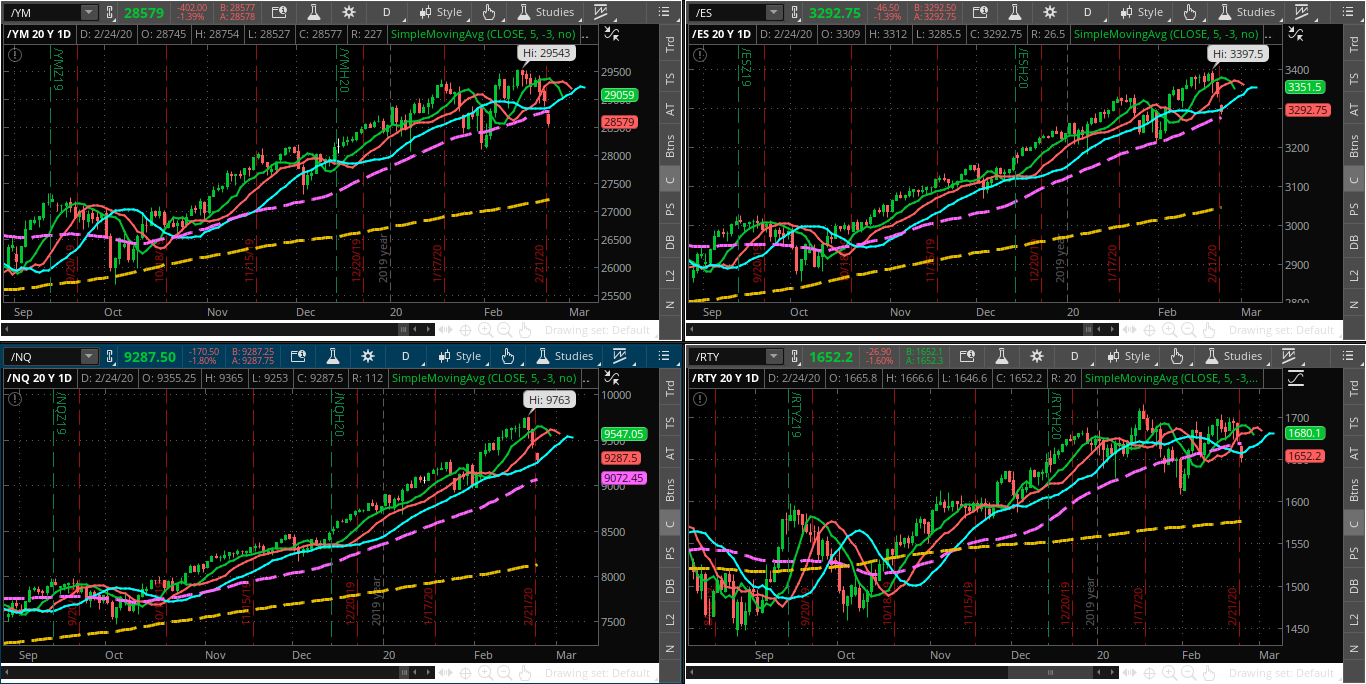
In fact, the weakest of these E-mini Futures Indices is the YM, inasmuch as the 5 and 8 are about to both cross below the 13 future-offset MA. If that occurs and the crossovers hold, watch for increased volatility and weakness, with the other three indices following suit, in the days ahead.
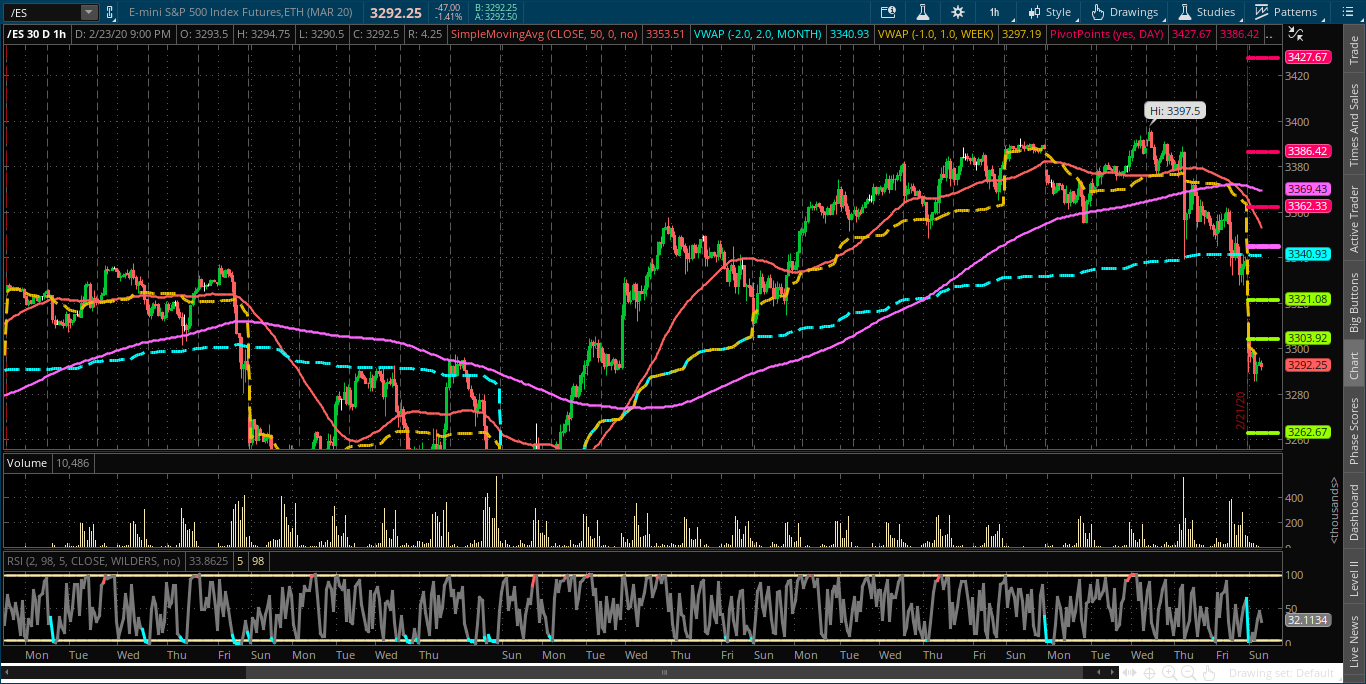
In the very short term, Monday's intraday Pivot Point targets for the ES are (as shown on the following 30-day 60-min chart):
R3 = 3427.67
R2 = 3386.42
R1 = 3362.33
PP = 3345.17
S1 = 3321.08
S2 = 3303.92
S3 = 3262.67
Weekly VWAP = 3297.18
Monthly VWAP = 3340.93
50-hr MA = 3353.53
200-hr MA = 3369.43
All of these levels, as well as the above-noted 50-day MA (3279) represent intraday support and resistance levels (potential targets) for Monday.
Finally, the following daily ratio chart of the SPX:VIX ratio shows that price gapped down and closed below the 200-day MA around the 200 price support level on Friday.
The RSI, MACD and PMO indicators are in downtrend, and price on this ratio failed to make a new swing high when the SPX hit its all-time high of 3393.52 on February 19. The RSI has dropped below the 50 level, the MACD has formed a bearish crossover, and the PMO is about to form a bearish crossover...all of which are hinting at further weakness ahead for the SPX.
BOTTOM LINE:
Unless we see a sharp snap-back in the above 4 E-mini Futures to new highs soon, together with a new swing high on the SPX:VIX ratio, look for increased volatility and further equity weakness in the near term.
Trading in financial instruments and/or cryptocurrencies involves high risks including the risk of losing some, or all, of your investment amount, and may not be suitable for all investors. Prices of cryptocurrencies are extremely volatile and may be affected by external factors such as financial, regulatory or political events. Trading on margin increases the financial risks.
Before deciding to trade in financial instrument or cryptocurrencies you should be fully informed of the risks and costs associated with trading the financial markets, carefully consider your investment objectives, level of experience, and risk appetite, and seek professional advice where needed.
Fusion Media would like to remind you that the data contained in this website is not necessarily real-time nor accurate. The data and prices on the website are not necessarily provided by any market or exchange, but may be provided by market makers, and so prices may not be accurate and may differ from the actual price at any given market, meaning prices are indicative and not appropriate for trading purposes. Fusion Media and any provider of the data contained in this website will not accept liability for any loss or damage as a result of your trading, or your reliance on the information contained within this website.
It is prohibited to use, store, reproduce, display, modify, transmit or distribute the data contained in this website without the explicit prior written permission of Fusion Media and/or the data provider. All intellectual property rights are reserved by the providers and/or the exchange providing the data contained in this website.
Fusion Media may be compensated by the advertisers that appear on the website, based on your interaction with the advertisements or advertisers.