S&P 500 Update: If 4565 Holds, Ideal Upside Target Could Hit 4750-4800
Dr. Arnout ter Schure | Nov 11, 2021 04:14PM ET
Ten days ago, using the Elliott Wave Principle and technical analysis, I wrote that the recent rally in the S&P 500:
“... ideally tops out soon, in the blue box up to SPX 4629, pulls back and should bottom around SPX 4535-4515, and should then rally back up to ideally SPX 4695-4725.”
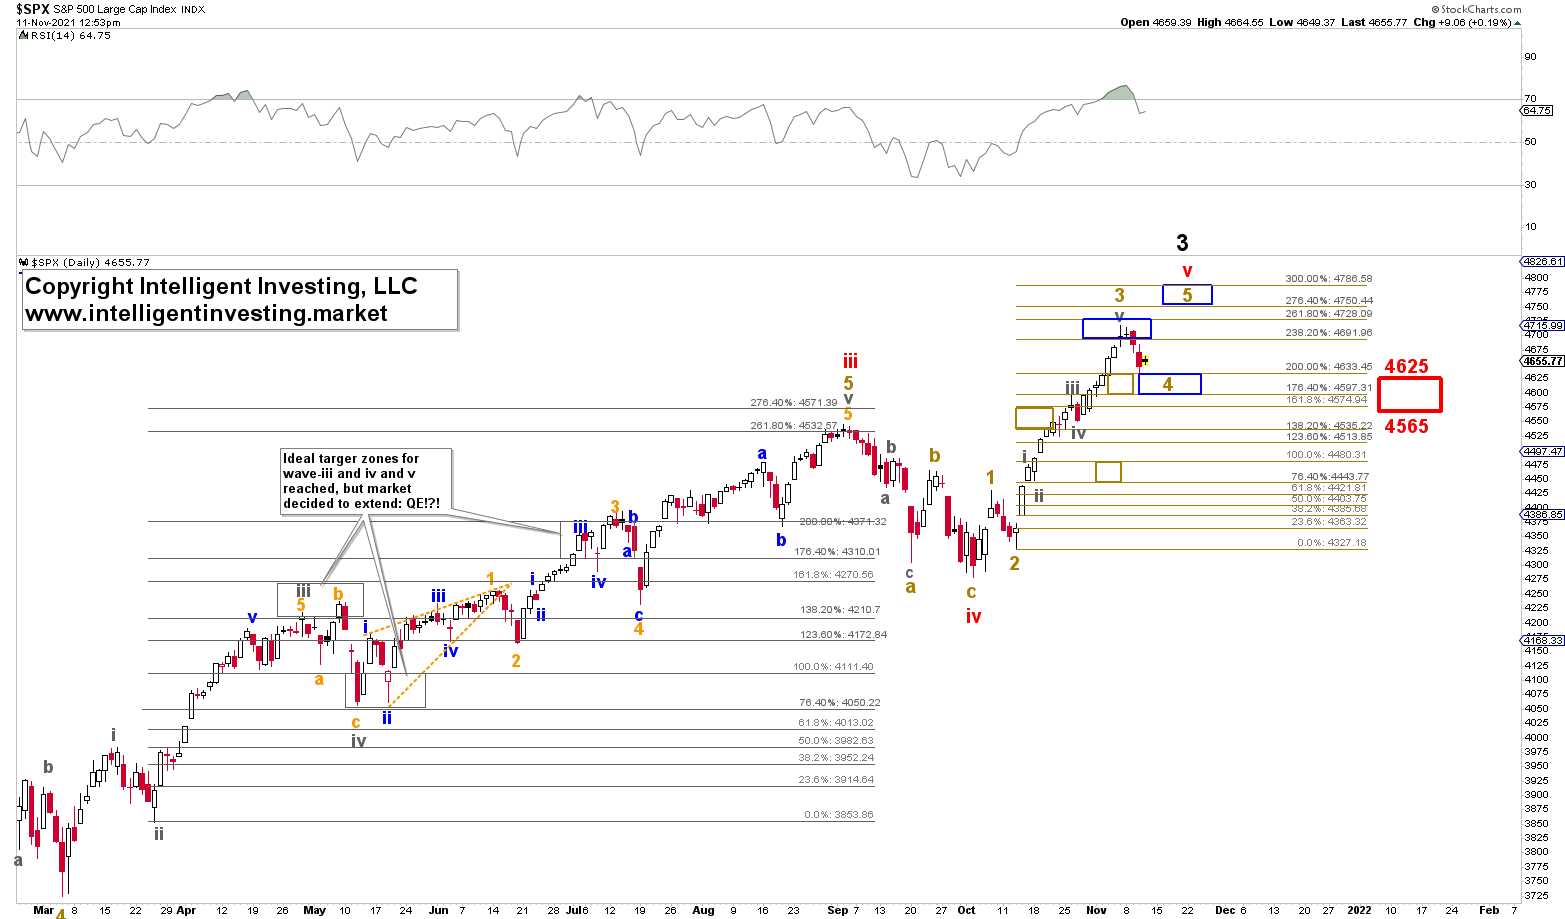
Fast forward, and the index did not top until Nov. 4, at SPX 4718. It then dropped yesterday to a low of SPX 4631. See Figure 1 below.
In the daily chart of the S&P 500, you can see:
- Elliott Waves of various degrees. This article focuses on the green (minor) waves starting from the early October (red intermediate wave-iv) low.
- The green Fibonacci-extensions of the minor-1 wave, measured from minor wave-2 low
- The green boxes represent the ideal/standard/textbook Fibonacci-based target zones for minor-3, 4, and 5.
- The blue boxes represent the extended Fibonacci-based target zones for the same waves.
Figure 1: S&P 500 daily chart with detailed EWP count and technical indicators
Hence, as said in my last update:
“The green boxes show where wave-3, 4, and 5 typically should top and bottom. However, that is only a textbook, standard, Fibonacci-based pattern, and the market does not have to follow these Fib-based levels. The current rally has not, i.e., it extended, and the blue boxes show where we should now expect wave-3, 4, and 5 to top out, bottom, and top again, respectively.”
Oh boy, did we get another extension on our hands or what?
Thanks to the Federal Reserve’s extra liquidity (QE), maybe? Regardless of the reason, the index topped right in the 238.2-261.8% Fib-extension target zone for, in my opinion, a very extended minor-3 wave. Then yesterday, it dropped to the upper end of the ideal wave-4 target zone.
The red box shows the typical 23.60-38.2% retrace zone of the minor-3rd wave. And so far, the SPX has dropped right to the upper end. Hence, the recent three-day drop has done enough to suggest the minor-4 is completed, albeit it can provide us with a few more twists and turns and go to as low as SPX 4565 if it wants to. But below that level, and I will have to re-assess the markets’ options as then the more extensive (black) wave-3 may have already topped.
However, based on the technical indicators’ extreme overbought readings and strong momentum at last week’s high, the preferred notion is that high was only a 3rd wave and not a 5th wave. Besides, the Philadelphia Semiconductor Index suggest that at least one more up leg is needed to finish the rally that started in early October as well.
Bottom line: The markets extended their 3rd wave well beyond normal levels for a 3rd wave and should now be close to completing a 4th wave as the upper end of the ideal target zone for this particular more minor wave has already been reached.
How to trade such extensions? I always suggest to my clients to raise stops and sell partial positions into strength. Never anticipate a move, but react to one. By doing so, one can stay within the trend for as long as possible while reducing risk. Besides, as I always say, “in bull markets, upside surprises and downside disappoints.” So far, that is what has happened. Moreover, thanks to the EWP, we know with certainty after wave three come wave four and five, and if the SPX can hold 4565, it should be able to move higher to ideally 4750-4800, baring any 5th wave extensions.
![]()
Trading in financial instruments and/or cryptocurrencies involves high risks including the risk of losing some, or all, of your investment amount, and may not be suitable for all investors. Prices of cryptocurrencies are extremely volatile and may be affected by external factors such as financial, regulatory or political events. Trading on margin increases the financial risks.
Before deciding to trade in financial instrument or cryptocurrencies you should be fully informed of the risks and costs associated with trading the financial markets, carefully consider your investment objectives, level of experience, and risk appetite, and seek professional advice where needed.
Fusion Media would like to remind you that the data contained in this website is not necessarily real-time nor accurate. The data and prices on the website are not necessarily provided by any market or exchange, but may be provided by market makers, and so prices may not be accurate and may differ from the actual price at any given market, meaning prices are indicative and not appropriate for trading purposes. Fusion Media and any provider of the data contained in this website will not accept liability for any loss or damage as a result of your trading, or your reliance on the information contained within this website.
It is prohibited to use, store, reproduce, display, modify, transmit or distribute the data contained in this website without the explicit prior written permission of Fusion Media and/or the data provider. All intellectual property rights are reserved by the providers and/or the exchange providing the data contained in this website.
Fusion Media may be compensated by the advertisers that appear on the website, based on your interaction with the advertisements or advertisers.