S&P 500 Struggles with Volume but Zweig Breadth Thrust Keeps Bulls in Control
Tim Ord | May 01, 2025 01:25AM ET
SPX Monitoring purposes; Sold 4/9/25 at 5456.90= gain 9.52%; Long SPX 4/8/25 at 4982.77.
Our gain 1/1/24 to 12/31/24 = 29.28%; SPX gain 23.67%
Our Gain 1/1/23 to 12/31/23 SPX= 28.12%; SPX gain 23.38%
Monitoring purposes GOLD: Sold long GDX 4/11/25 at 49.66 = gain 21.33%.
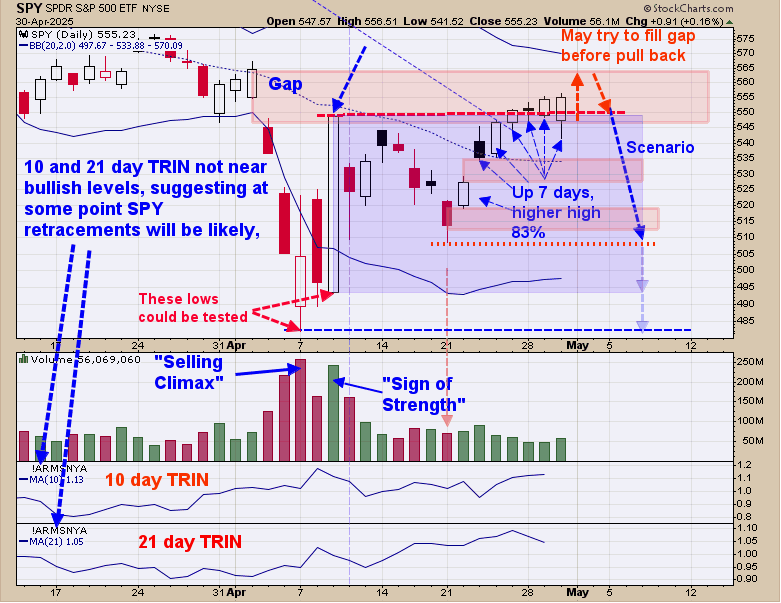
We ended up at 29.28% for 2024; SPX up 23.67% for the year. The April 9 high is being tested and tested on lighter volume, suggesting resistance. We noted in shaded pink where a gap lies, and that gap may be filled before the potential pullback begins. If the SPY can’t get through the 4/9 high with equal or higher volume, it will reverse and attempt to take out the previous low, which is April 21.
The April 21 low comes in near 508 SPY; and if tested with lighter volume, will imply support. Today marked 7 days up in a row, suggesting SPY will be higher within 5 days 83% of the time, giving credit for the 4/3 gap fill. Intermediate term, the SPY appears to be building a base, especially with a ZBT trigger.
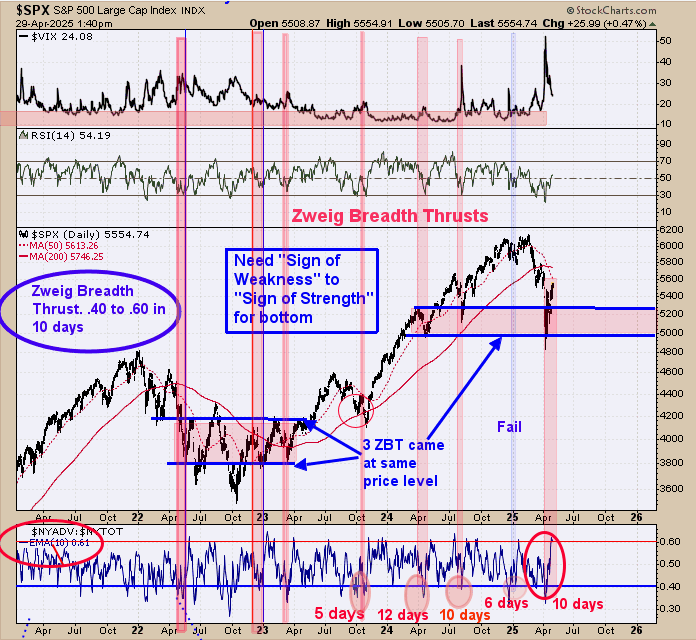
Yesterday's commentary still applies: “The bottom window in the chart above is the 'Zweig Breadth Thrust indicator (ZBT). A ZBT is the NYSE Advancing issues/NYSE total issues with a 10-period moving average. A ZBT is triggered when this indicator reaches .40 or lower and then rallies to .60 or higher in 10 days or less. A ZBT was triggered last Thursday.
We noted previous ZBTs in shaded pink. It is said that a ZBT only shows up in bull markets. ZBT can trace back down where to where the pattern began, if not a bit lower (note the 2022 early 2023 bottom). A triggered ZBT suggests a bottom pattern has started.” Added to the above, we shaded in pink and lined with blue lines where the ZBT was triggered. Note that ZBT came in near the same price levels as the previous ZBT, where triggered back in April and July 2024.
Worth a repeat, “The middle window is the monthly HUI/NDX ratio, and the next window higher is the RSI for this ratio. The top window is the monthly HUI, and the bottom window is the monthly NDX. There are not enough data points for a confirmed cycle, but there appears to be a 12-year cycle in the HUI/NDX ratio.
A rising HUI/NDX shows that HUI is outperforming NDX and vice versa. What kicks off a new up cycle is when the RSI rises above +60, after which it has been below 50 for a number of years.
A new down cycle starts when the RSI falls below 40, after which it has been above 50 for a number of years (we noted in shade green when RSI is above 50 and shaded pink when below). The monthly RSI has been generally below 50 since 2012, and has recently jumped to +61, showing that HUI is outperforming NDX.
As long as the monthly RSI of the HUI/NDX ratio stays above 50, then HUI will outperform NDX. The previous two cycles lasted 12 years. There are a lot of penny gold stocks, and some may turn into multi-dollar stocks.”
Trading in financial instruments and/or cryptocurrencies involves high risks including the risk of losing some, or all, of your investment amount, and may not be suitable for all investors. Prices of cryptocurrencies are extremely volatile and may be affected by external factors such as financial, regulatory or political events. Trading on margin increases the financial risks.
Before deciding to trade in financial instrument or cryptocurrencies you should be fully informed of the risks and costs associated with trading the financial markets, carefully consider your investment objectives, level of experience, and risk appetite, and seek professional advice where needed.
Fusion Media would like to remind you that the data contained in this website is not necessarily real-time nor accurate. The data and prices on the website are not necessarily provided by any market or exchange, but may be provided by market makers, and so prices may not be accurate and may differ from the actual price at any given market, meaning prices are indicative and not appropriate for trading purposes. Fusion Media and any provider of the data contained in this website will not accept liability for any loss or damage as a result of your trading, or your reliance on the information contained within this website.
It is prohibited to use, store, reproduce, display, modify, transmit or distribute the data contained in this website without the explicit prior written permission of Fusion Media and/or the data provider. All intellectual property rights are reserved by the providers and/or the exchange providing the data contained in this website.
Fusion Media may be compensated by the advertisers that appear on the website, based on your interaction with the advertisements or advertisers.