S&P 500: Resistance Builds Near Recent High as Volume Signals a Pause
Tim Ord | Apr 24, 2025 01:54AM ET
SPX Monitoring purposes; Sold 4/9/25 at 5456.90= gain 9.52%; Long SPX 4/8/25 at 4982.77.
Our gain 1/1/24 to 12/31/24 = 29.28%; SPX gain 23.67%
Our Gain 1/1/23 to 12/31/23 SPX= 28.12%; SPX gain 23.38%
Monitoring purposes GOLD: Sold long GDX 4/11/25 at 49.66 = gain 21.33%.
We ended up 29.28% for 2024; SPX up 23.67% for the year. Most likely the April 9 high will be tested and if tested on lighter volume will suggests resistance. April 9 volume came in at 241 million shares, so the test most likely will be on lighter volume which suggests resistance. If the SPY can’t get through the 4/9 high, it will reverse and attempt to take out the previous low which is also on April 9.

The April 9 low comes in near 493 SPY. Don’t see a good setup for the moment. Intermediate term the SPY appears to be building a base and the second half of the year is starting to look favorable.
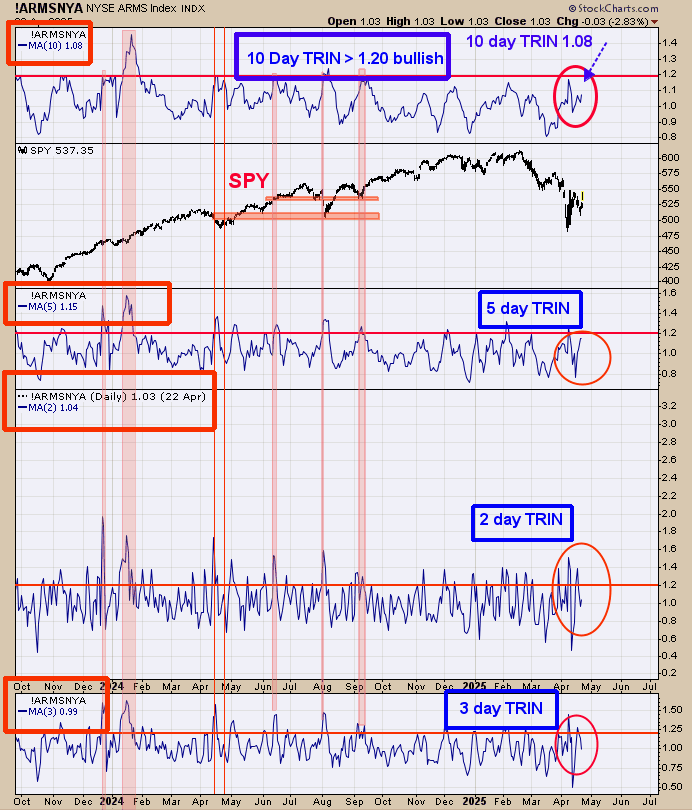
The top window is the 10-day TRIN, which stands at 1.08 and neutral; needs to be near 1.20 or higher for a bull case. The 10-day TRIN of 1.20 shows panic and panic forms near lows. Next lower window is the 5-day TRIN with a reading of 1.15; leans bullish; next lower window is the 2-day TRIN with a reading of 1.04 neutral; and bottom window is the 3-day TRIN with a reading of .99 neutral.
We keep showing this chart as this chart will help to define the next low. We are waiting for panic to form in the market, which is identified when the trin closes above 1.20, which in turn will help define the next low. Of the moving averages of the TRIN, the 10-day TRIN (two weeks of trading) is the most important as it is the longest timeframe (longer time frames rule the shorter time frames).
The “Three Drives to a top” appears to be working out. It is said that “Three Drives to a top” is not a top pattern but rather a “Time out in an uptrend”. This pattern has a downside target to where the pattern began which in the current case would have a price projection near 39.00.
From the 39.00 range it would be expected for the next rally to begin and most likely to new highs. We have presented chart studies over the last several months that a multi-year rally is possible in the gold stocks.
Trading in financial instruments and/or cryptocurrencies involves high risks including the risk of losing some, or all, of your investment amount, and may not be suitable for all investors. Prices of cryptocurrencies are extremely volatile and may be affected by external factors such as financial, regulatory or political events. Trading on margin increases the financial risks.
Before deciding to trade in financial instrument or cryptocurrencies you should be fully informed of the risks and costs associated with trading the financial markets, carefully consider your investment objectives, level of experience, and risk appetite, and seek professional advice where needed.
Fusion Media would like to remind you that the data contained in this website is not necessarily real-time nor accurate. The data and prices on the website are not necessarily provided by any market or exchange, but may be provided by market makers, and so prices may not be accurate and may differ from the actual price at any given market, meaning prices are indicative and not appropriate for trading purposes. Fusion Media and any provider of the data contained in this website will not accept liability for any loss or damage as a result of your trading, or your reliance on the information contained within this website.
It is prohibited to use, store, reproduce, display, modify, transmit or distribute the data contained in this website without the explicit prior written permission of Fusion Media and/or the data provider. All intellectual property rights are reserved by the providers and/or the exchange providing the data contained in this website.
Fusion Media may be compensated by the advertisers that appear on the website, based on your interaction with the advertisements or advertisers.