S&P 500: Possible Bullish Wedge
Dr. Arnout ter Schure | Mar 11, 2022 02:16PM ET
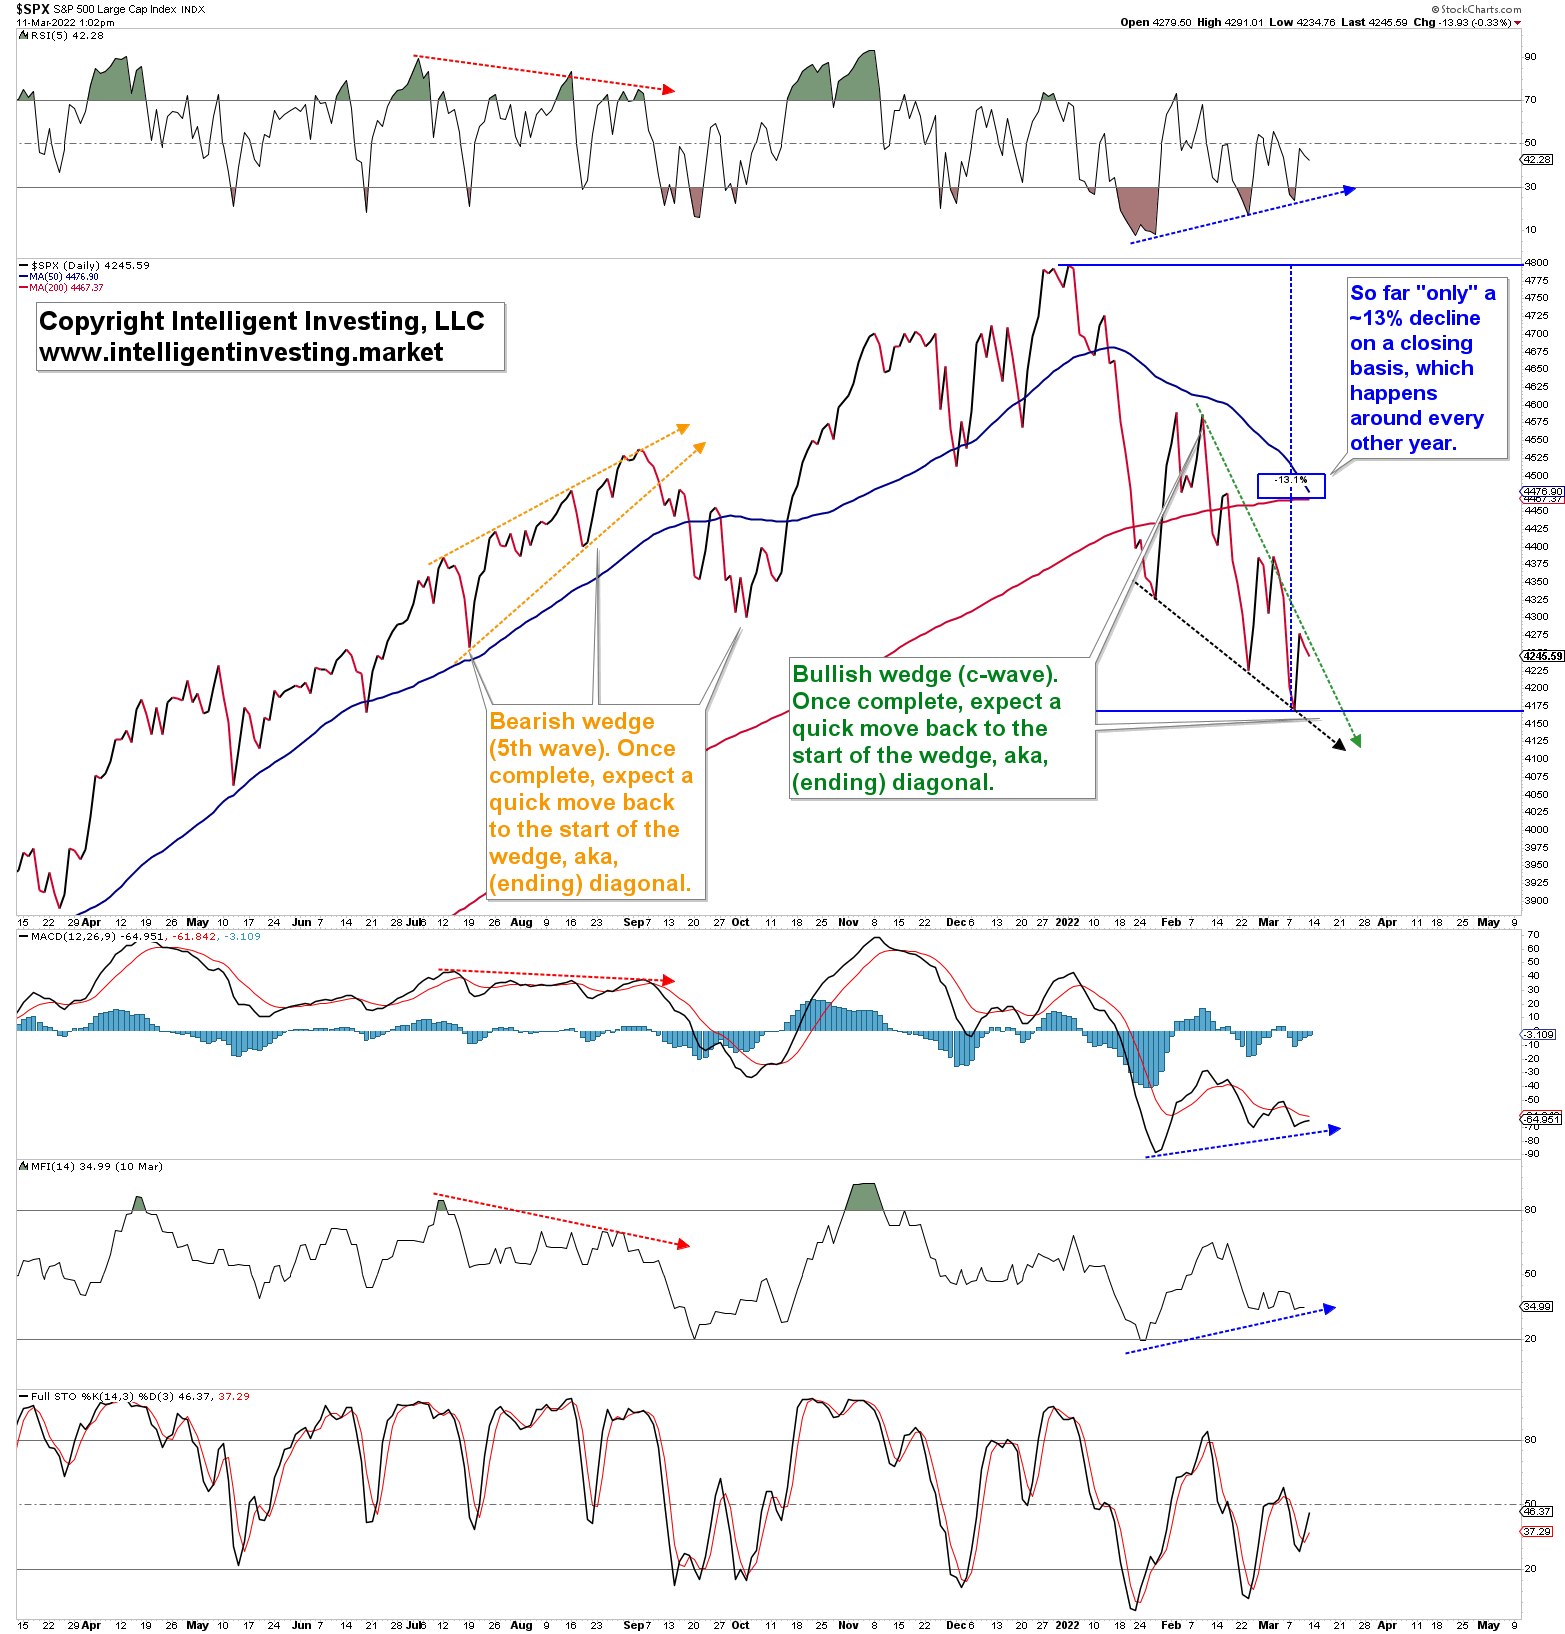
To simplify the already complicated price action of the S&P 500 (SPX) daily, it helps to look at closing prices. A line chart accomplishes this as it takes out all the intra-day noise. Besides, the closing price is the essential price of the day.
Figure 1 below shows the SPX line chart over the last year. Things to notice are
- So far, the index has experienced a ~13% correction on a closing basis, which happens every 1.6 to 2.5 years (source here ).
- Price appears to form a falling wedge (black-green dotted arrows, in the Elliott Wave Principle, called a diagonal). The wedge points down and should resolve higher when complete.
- Potential positive divergence between price and several technical indicators is forming (blue dotted arrows: lower prices but indicators are less weak)
Figure 1. S&P 500 daily line charts with technical patterns and indicators:
Not shown here, but:
- Despite only a ~13% decline, investor sentiment is extremely negative and similarly bearish as the lows in 2010, 2011, 2015, 2016, 2019, and 2020, which were in all cases even more significant corrections.
- Average seasonality for a US Presidential Election Cycle Mid-Term Year tells of weakness into mid-March followed by a strong rally.
Is More Downside Likely?
The last time the SPX experienced a double-digit decline was September 2020 and March 2020. Thus the current “once every 1.6-2.5 year” decline is right on cue. How reliable are wedges, aka diagonals? Well, see Figure 1; for example, the index formed a bearish rising wedge July-August last year (orange arrows) on negative divergence (red dotted arrows) and resolved lower to the start of the wedge. Thus expect the same if the current bullish falling wedge resolves: retest of SPX4600+ in rapid order.
Sentiment can be a great contrarian indicator as the market often moves in the opposite direction of where the majority thinks it should go. Or, as legendary trader Jesse Livermore once said, “markets are never wrong; opinions are.” And. famous investor Warren Buffett once said that it is wise for investors to be “fearful when others are greedy, and greedy when others are fearful.”
Lastly, the index is right on track for a critical low in the middle of this month and should then rally strongly into April-May with the typical summer lull to follow.
Bottom Line
The S&P 500 is exhibiting a bullish pattern, called a falling wedge or an ending diagonal C-wave in EWP terms. This pattern projects a move to SPX4600+ for starters. Is that possible, given all that is going on in the world?
Yes, price patterns must be respected regardless, and meanwhile, sentiment is in the gutter, whereas average seasonality suggests a significant low should be formed around the current time frame. Thus, as long as the February 24 low holds, bulls are in charge, as I showed in my recent update on the Russell 2000. And the longer it lasts for the bears to move price below that low, the less likely it will become they succeed: time and price matter.
Trading in financial instruments and/or cryptocurrencies involves high risks including the risk of losing some, or all, of your investment amount, and may not be suitable for all investors. Prices of cryptocurrencies are extremely volatile and may be affected by external factors such as financial, regulatory or political events. Trading on margin increases the financial risks.
Before deciding to trade in financial instrument or cryptocurrencies you should be fully informed of the risks and costs associated with trading the financial markets, carefully consider your investment objectives, level of experience, and risk appetite, and seek professional advice where needed.
Fusion Media would like to remind you that the data contained in this website is not necessarily real-time nor accurate. The data and prices on the website are not necessarily provided by any market or exchange, but may be provided by market makers, and so prices may not be accurate and may differ from the actual price at any given market, meaning prices are indicative and not appropriate for trading purposes. Fusion Media and any provider of the data contained in this website will not accept liability for any loss or damage as a result of your trading, or your reliance on the information contained within this website.
It is prohibited to use, store, reproduce, display, modify, transmit or distribute the data contained in this website without the explicit prior written permission of Fusion Media and/or the data provider. All intellectual property rights are reserved by the providers and/or the exchange providing the data contained in this website.
Fusion Media may be compensated by the advertisers that appear on the website, based on your interaction with the advertisements or advertisers.