S&P 500 Index: Poised For A June Breakout?
Candy Matheson | May 31, 2018 12:06AM ET
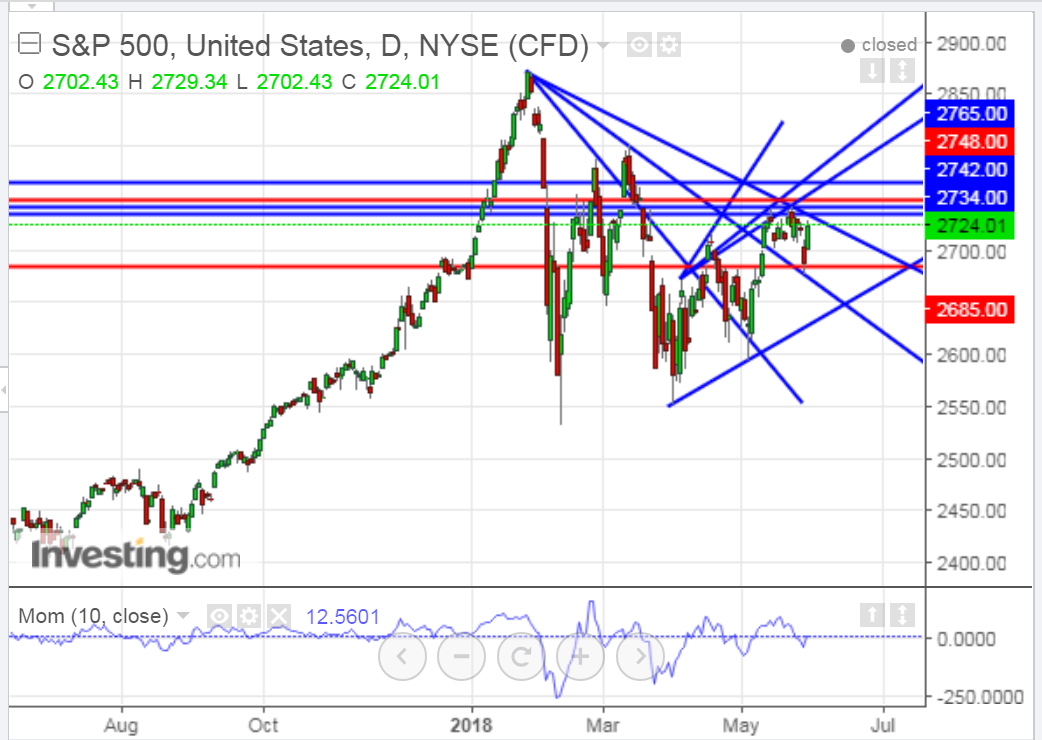
In my last post on the S&P 500 Index (SPX), I mentioned 2750 as major resistance and 2680 as near-term support.
Since then, price has bounced around in between those levels, as shown on the daily chart below. At the moment, those two levels are confirmed by a variety of intersecting trendlines...most notably the two red horizontal lines (2748 and 2685), which are the nearest to these two levels.
Until we see a clean break and hold either above or below this red consolidation zone, the SPX will continue its sometimes extreme, volatile whipsaw action in a trendless manner.
It's unclear whether momentum favors a breakout to the upside, inasmuch as the last swing high on the momentum indicator was lower than its previous swing high, in a divergence with the last two swing highs made by the price. However, this may have been intentional and meant to be used as a possible "bear trap" in preparation for the resumption of the rally that began in early April.
Perhaps the month of June will produce either a decisive continuation and confirmation of this 2-month uptrend, or a reversal, which may become clearer after this Friday's employment data is released. Keep a close eye on the momentum indicator to support a "red zone" breakout in either direction.
Inasmuch as the July 4th Independence Day holiday is only a month away, I'd make a wild guess that market players will favor a breakout to the upside, possibly producing a new record high by then before taking some profits to enjoy for the summer holidays...so, we'll see.
![]()
Trading in financial instruments and/or cryptocurrencies involves high risks including the risk of losing some, or all, of your investment amount, and may not be suitable for all investors. Prices of cryptocurrencies are extremely volatile and may be affected by external factors such as financial, regulatory or political events. Trading on margin increases the financial risks.
Before deciding to trade in financial instrument or cryptocurrencies you should be fully informed of the risks and costs associated with trading the financial markets, carefully consider your investment objectives, level of experience, and risk appetite, and seek professional advice where needed.
Fusion Media would like to remind you that the data contained in this website is not necessarily real-time nor accurate. The data and prices on the website are not necessarily provided by any market or exchange, but may be provided by market makers, and so prices may not be accurate and may differ from the actual price at any given market, meaning prices are indicative and not appropriate for trading purposes. Fusion Media and any provider of the data contained in this website will not accept liability for any loss or damage as a result of your trading, or your reliance on the information contained within this website.
It is prohibited to use, store, reproduce, display, modify, transmit or distribute the data contained in this website without the explicit prior written permission of Fusion Media and/or the data provider. All intellectual property rights are reserved by the providers and/or the exchange providing the data contained in this website.
Fusion Media may be compensated by the advertisers that appear on the website, based on your interaction with the advertisements or advertisers.