S&P 500 Futures: How Low Can They Go Before A Sustained Bottom Is In?
Dr. Arnout ter Schure | Apr 26, 2022 02:42PM ET
Over the last few weeks, see, for example, here and here, I have kept you abreast of how the current ongoing correction in the S&P 500 futures (ES) should unfold using the .
So far, the index has not disappointed. Namely, the anticipated multi-day bounce to 4500-4570 came and went as the index topped at 4509 on April 21st. Now the S&P 500 futures is trading at the low 4200s.
Thus, the forecasted “subsequent decline to ideally 4115+/-25…” is underway (see Figure 1 below) and the EWP has been an accurate and reliable tool to forecast the futures market’s next moves.
So, the question is, what’s next?
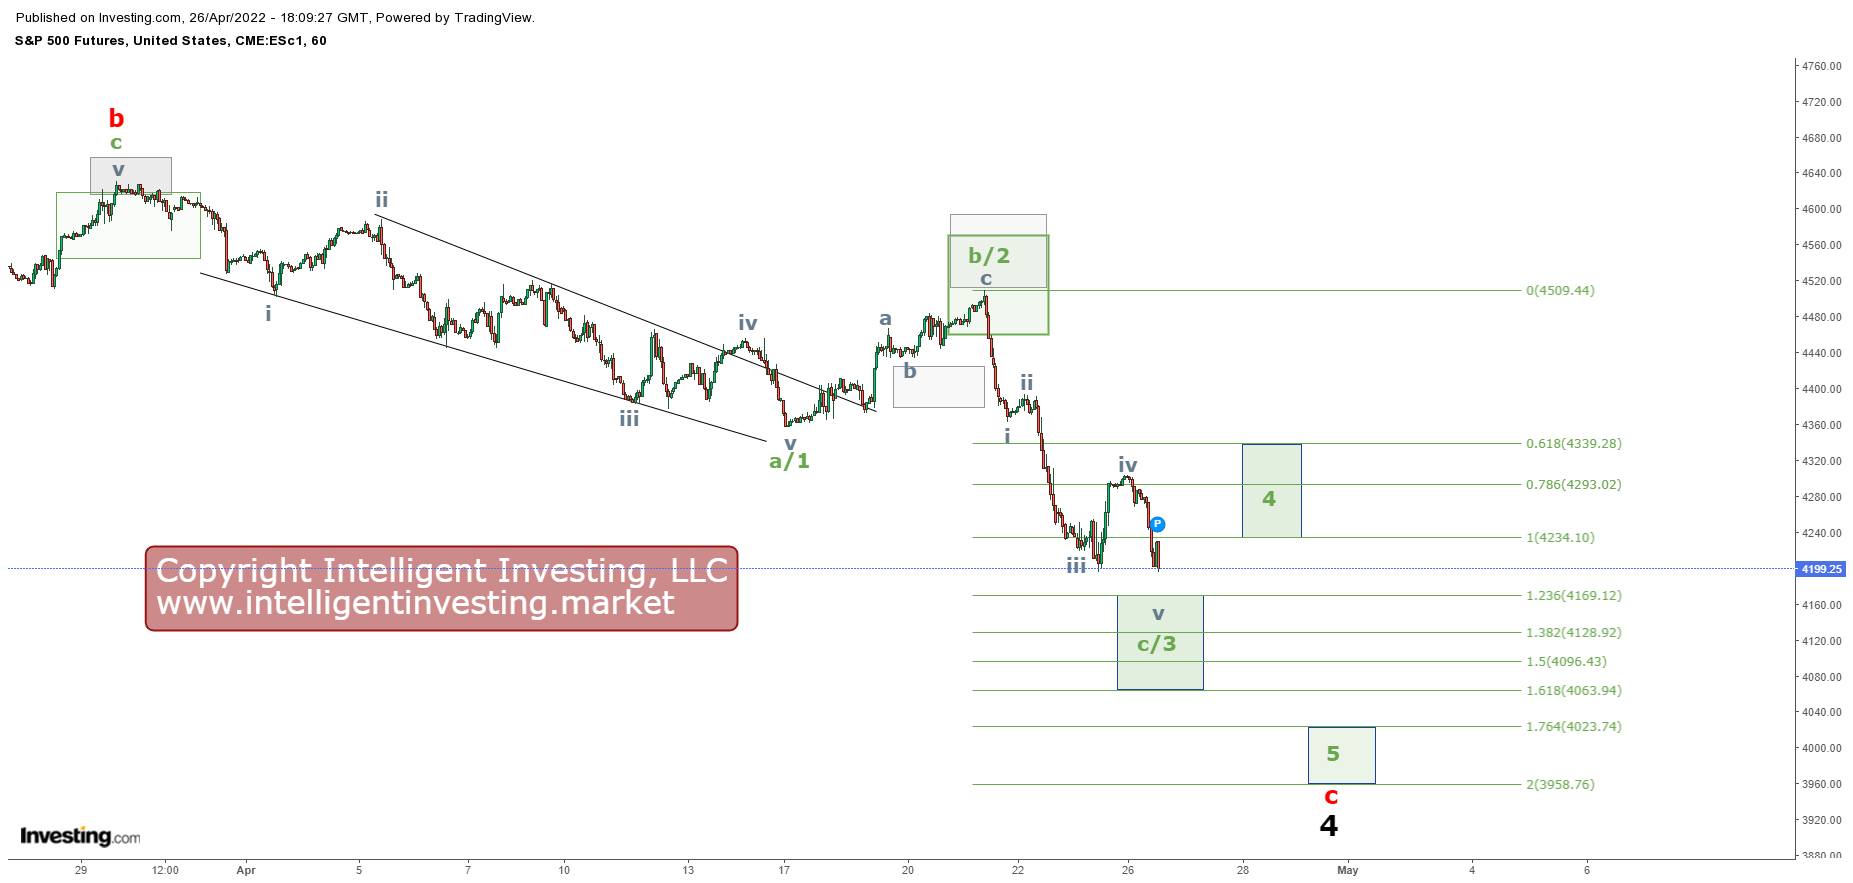
Figure 1. ES hourly candlestick chart with detailed EWP count and several technical indicators
Correction Is Unfolding As It Should
One always must anticipate, monitor, and adjust. For now, the index is progressing as anticipated. I see, therefore, no reason to change the next part of my forecast:
“Once that target zone [4115+/-25] is reached, the index should bounce again to 4315+/-25 (4), followed by a final decrease to 4050+/-25 (green wave-5, of red wave-c, of black wave-4).”
Other than a minor tweak in that wave (c/3) could stall at the 123.60% extension (4170+/-5), and wave-4 could bounce back to as high as the 61.80% level (4340+/-5).
Bottom Line
The EWP continues to run supreme because last week, the ES bottomed right where I thought it would, 4375 vs. 4370, and staged the anticipated rally right to where I thought it would; SPX4500+/-25 vs. 4509.
The expected subsequent decline to ideally 4115+/-25 (green c/3) is now underway, but it could stall at 4170+/-5. I, therefore, continue to expect a bounce soon to ideally 4235-4295, but possibly as high as 4340 before the last leg lower of this significant correction that started January 4th completes at ideally 3960-4025.
![]()
Trading in financial instruments and/or cryptocurrencies involves high risks including the risk of losing some, or all, of your investment amount, and may not be suitable for all investors. Prices of cryptocurrencies are extremely volatile and may be affected by external factors such as financial, regulatory or political events. Trading on margin increases the financial risks.
Before deciding to trade in financial instrument or cryptocurrencies you should be fully informed of the risks and costs associated with trading the financial markets, carefully consider your investment objectives, level of experience, and risk appetite, and seek professional advice where needed.
Fusion Media would like to remind you that the data contained in this website is not necessarily real-time nor accurate. The data and prices on the website are not necessarily provided by any market or exchange, but may be provided by market makers, and so prices may not be accurate and may differ from the actual price at any given market, meaning prices are indicative and not appropriate for trading purposes. Fusion Media and any provider of the data contained in this website will not accept liability for any loss or damage as a result of your trading, or your reliance on the information contained within this website.
It is prohibited to use, store, reproduce, display, modify, transmit or distribute the data contained in this website without the explicit prior written permission of Fusion Media and/or the data provider. All intellectual property rights are reserved by the providers and/or the exchange providing the data contained in this website.
Fusion Media may be compensated by the advertisers that appear on the website, based on your interaction with the advertisements or advertisers.