S&P 500 Futures Hover at 20-Week EMA With Bulls Seeking Breakout
Al Brooks | May 12, 2025 01:36AM ET
Market Overview: S&P 500 Emini Futures
The S&P 500 Emini formed a weekly strong Emini pullback testing the 20-week EMA. If there is a pullback, the bulls want it to be minor, forming a double bottom bull flag (and a higher low) with the April 21 low. The bears They want the 20-week EMA or the March 25 high to act as resistance.
S&P 500 Emini Futures
The Weekly S&P 500 Emini Chart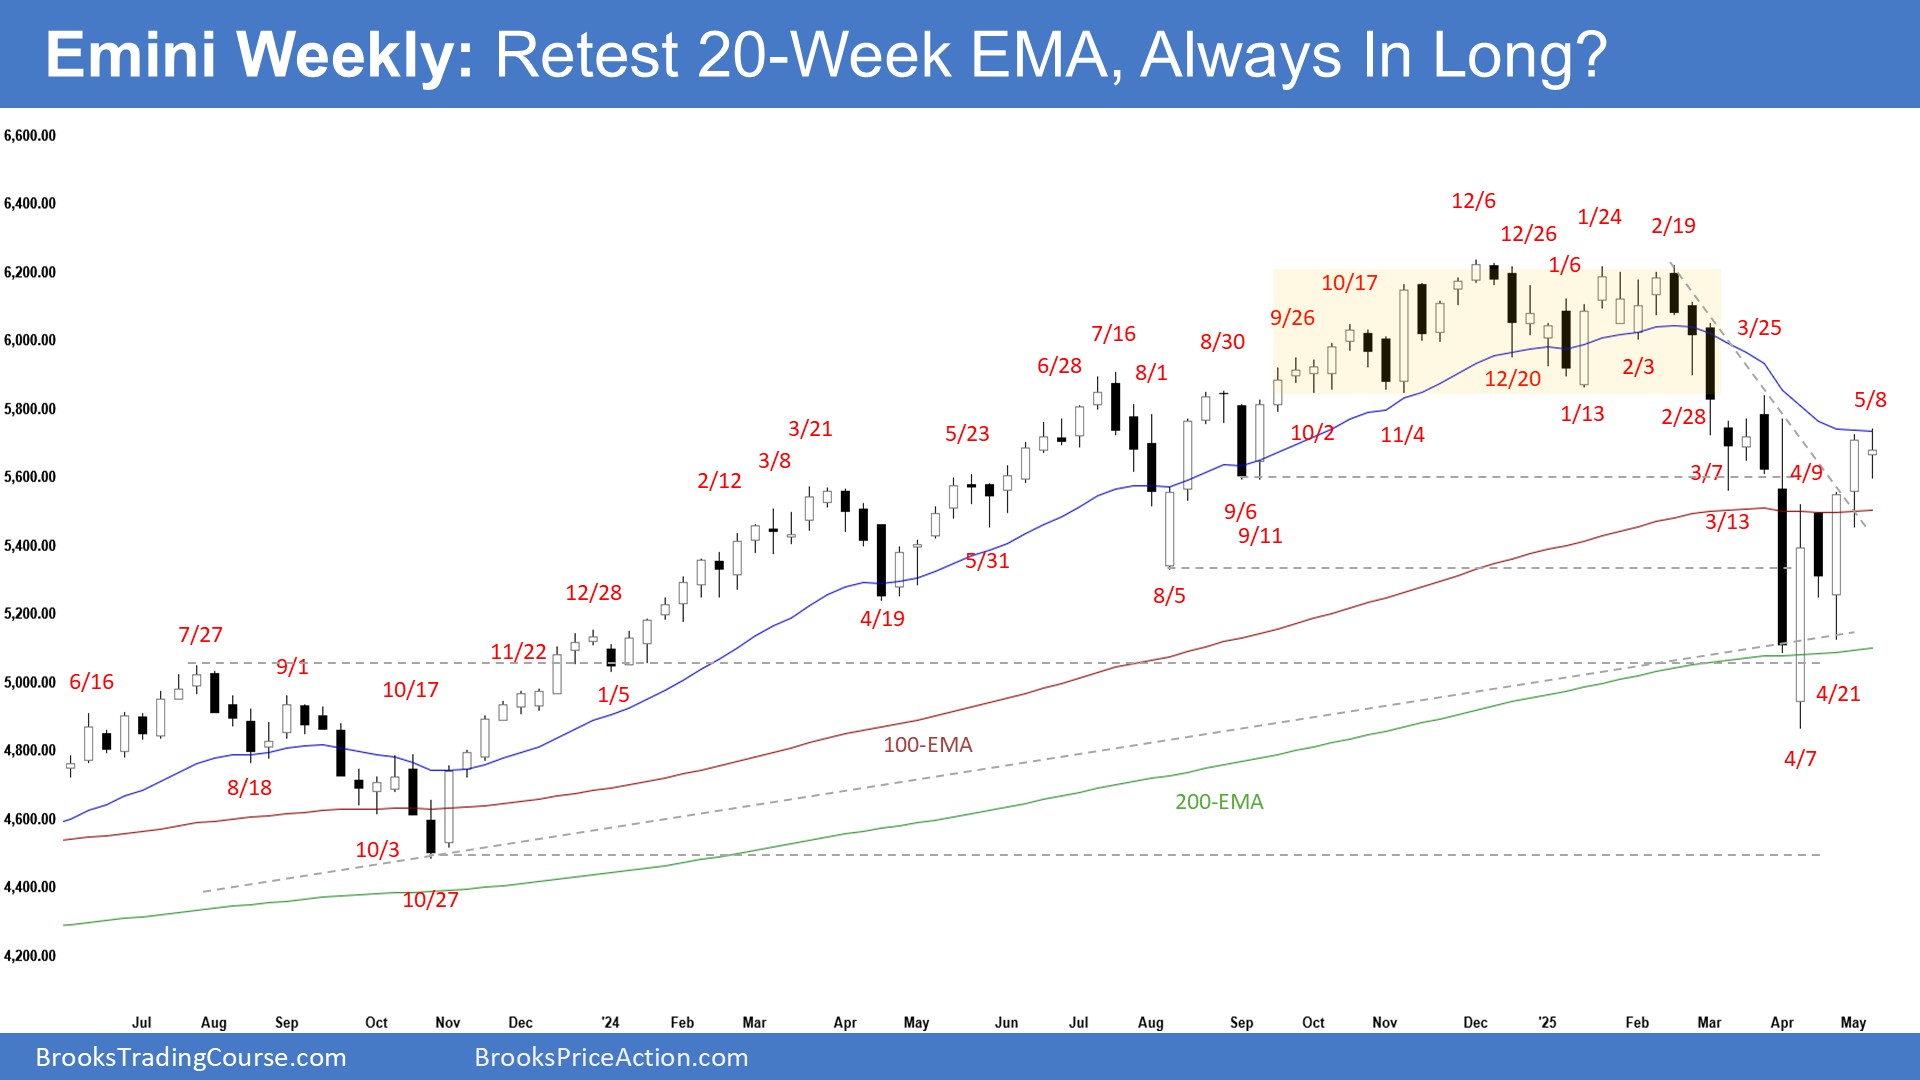
- This week’s Emini candlestick was a bull doji closing around the middle of its range with long tails above and below.
- Last week, we said the market could still trade a little higher towards the March 25 high area. Traders would see if the bulls could create a follow-through bull bar closing above the 20-week EMA, or if the market would trade slightly higher but close with a long tail above or with a bear body instead.
- The market traded sideways for the week.
- The bulls got a two-legged pullback testing the 20-week EMA.
- They see the selloff (Apr 7) forming a major higher low and the market being in a broad bull channel.
- They hope that the strong selloff has alleviated the prior overbought condition. They want a resumption of the trend.
- They got a reversal from a higher low major trend reversal (Apr 21).
- If there is a pullback, they want it to be minor, forming a double bottom bull flag (and a higher low) with the April 21 low.
- They hope the market has flipped into Always In Long.
- They must create more follow-through buying trading above the 20-week EMA and the March 25 high to increase the odds of a trend resumption.
- The bears got a large 2-legged selloff testing the 200-week EMA.
- They see the current move as a deep pullback and a buy vacuum test of the March 25 high.
- They want a reversal from a large double top bear flag (Mar 25 and May 8).
- They hoped to get a retest of the prior leg’s extreme low (April 7), even if it only forms a higher low.
- They want the 20-week EMA or the March 25 high to act as resistance.
- So far, the buying pressure since the April 7 low has been stronger (strong bull bars closing near their highs) than the weaker selling pressure (bear bars with limited follow-through selling).
- The market is currently stalling around the 20-week EMA.
- The doji bar could indicate an area of temporary balance.
- If the market continues to stall around the current levels, we may see a pullback towards the April 21 low area.
- For now, traders will see if the bulls can create a more follow-through bull bar closing above the 20-week EMA.
- Or will the market stall around the 20-week EMA, followed by another leg down instead?
- News of the tariff talks with China can cause the market to have big gaps next week (in either direction).
The Daily S&P 500 Emini Chart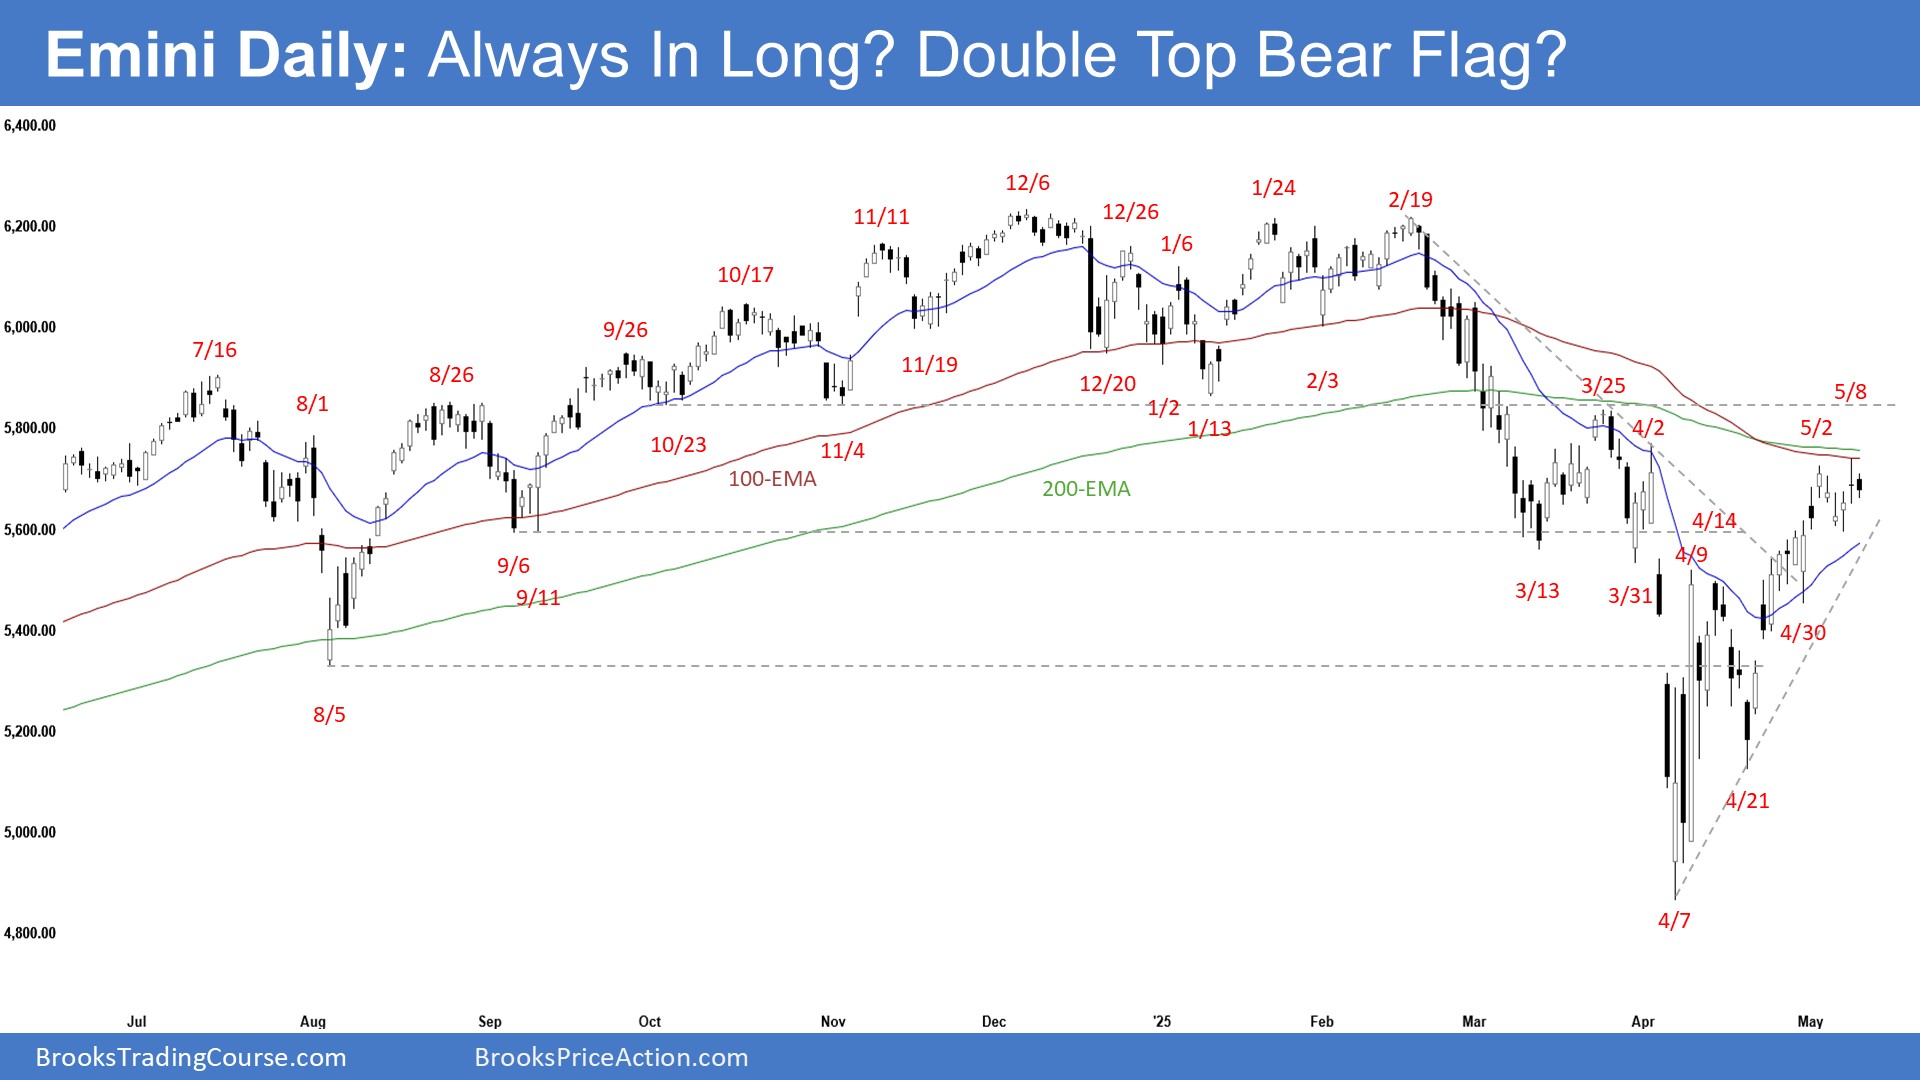
- The market traded sideways for the week. Thursday gapped higher but closed as a doji. Friday was an inside bear bar.
- Previously, we said the market may still be in the sideways to up pullback phase. Traders would see if the bulls could create more bull bars, breaking far above the 20-day EMA and the bear trend line or fail to do so.
- The bulls got a large second leg sideways to up testing near the 200-day EMA and the March 25 high.
- They see the market forming a major higher low (Apr 7) and want the broad bull channel to continue.
- They hope the selloff has alleviated the prior overbought condition and that the market has flipped back into Always In Long.
- If there is a pullback, they want it to form a double bottom bull flag (and a higher low) with the April 21 low.
- They want the 20-day EMA to act as support.
- The bears see the current move as a large 2-legged pullback.
- They want the market to form a lower high and a reversal from a double top bear flag (Mar 25 and May 8). They see a smaller double top (May 2 and May 8).
- They hope to get a retest of the April 7 low, even if it only forms a higher low.
- They must create strong bear bars to show they are back in control.
- So far, the buying pressure since the April 21 low is stronger (consecutive bull bars) than the weaker selling pressure (bear bars with no follow-through selling).
- The last 7 candlesticks had a lot of overlapping range, which indicates the market has temporarily stalled.
- Traders will see if the bulls can create more bull bars closing above the 200-day EMA and testing near the March 25 high.
- Or will the market stall around the current levels, followed by another leg down to test near the April 21 low instead?
- News of the tariff talks with China can cause the market to have big gaps next week (in either direction).
Trading in financial instruments and/or cryptocurrencies involves high risks including the risk of losing some, or all, of your investment amount, and may not be suitable for all investors. Prices of cryptocurrencies are extremely volatile and may be affected by external factors such as financial, regulatory or political events. Trading on margin increases the financial risks.
Before deciding to trade in financial instrument or cryptocurrencies you should be fully informed of the risks and costs associated with trading the financial markets, carefully consider your investment objectives, level of experience, and risk appetite, and seek professional advice where needed.
Fusion Media would like to remind you that the data contained in this website is not necessarily real-time nor accurate. The data and prices on the website are not necessarily provided by any market or exchange, but may be provided by market makers, and so prices may not be accurate and may differ from the actual price at any given market, meaning prices are indicative and not appropriate for trading purposes. Fusion Media and any provider of the data contained in this website will not accept liability for any loss or damage as a result of your trading, or your reliance on the information contained within this website.
It is prohibited to use, store, reproduce, display, modify, transmit or distribute the data contained in this website without the explicit prior written permission of Fusion Media and/or the data provider. All intellectual property rights are reserved by the providers and/or the exchange providing the data contained in this website.
Fusion Media may be compensated by the advertisers that appear on the website, based on your interaction with the advertisements or advertisers.