S&P 500, Dow Jones Q3 Outlook: Tariffs, Tech, and Small Cap Concerns
MarketPulse | Jul 04, 2025 09:50AM ET
Markets remain very much in limbo when it comes to US tariffs and trade negotiations. However, looking at risk assets and US equities in particular, one would none the wiser as to the bevy of risks that lie ahead.
Let us take a look at what we can expect from Q3.
S&P 500 Prints Fresh All-Time Highs, Can the Rally Continue?
The S&P 500 finished Q2 with a flourish as optimism has continued to grow that trade deals will be reached between the US and a host of trading partners. The S&P rallied to print fresh all-time highs in the last week of June with US Treasury Secretary Scott Bessent recently remarking that about 100 countries will get a minimum 10% reciprocal tariff.
On July 9th, President Trump's 90-day tariff pause will officially expire.
The surprise for many in regard to the US stock market comes from the fact that foreign investors appear to be diversifying out of US stocks in 2025. Investors from overseas withdrew $5 billion from US equity ETFs over the last month, the largest outflow in at least 3 years.
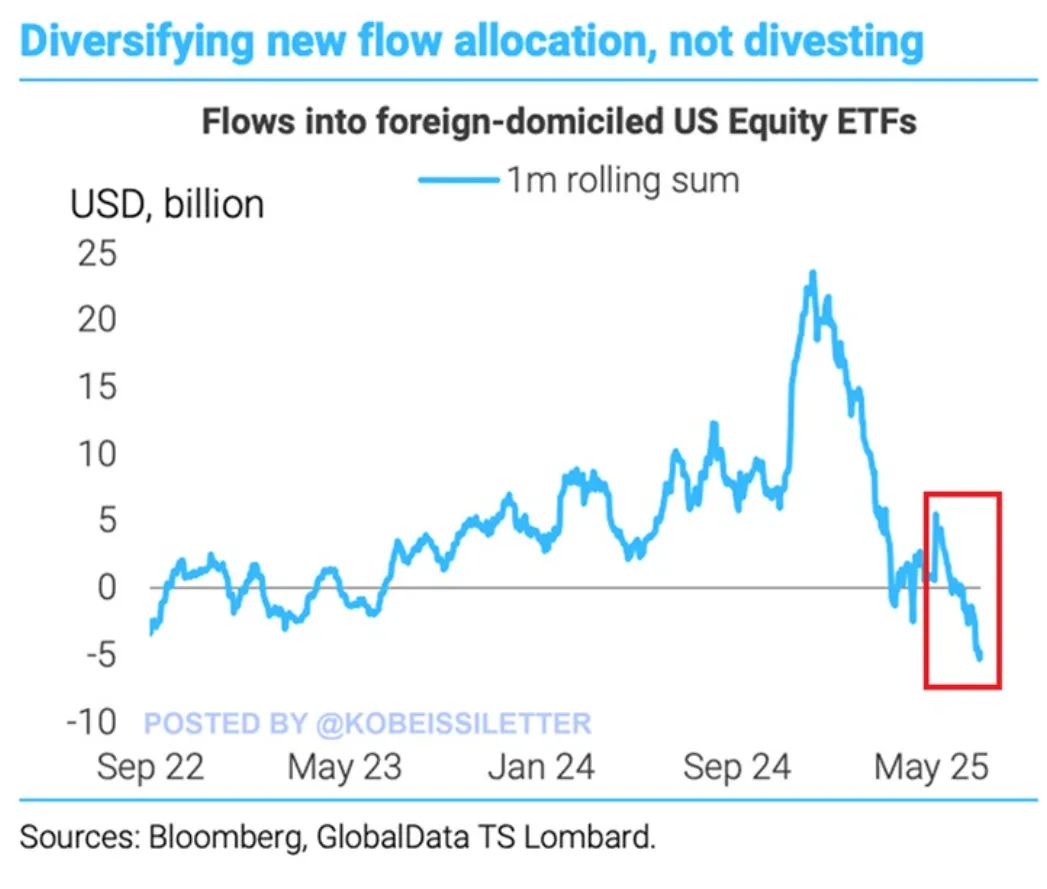
Source: Bloomberg, Kobeissi Letter
This is all despite the S&P 500 rallying +5% over the last month and hitting an all-time high for the first time since February.
However, I always believe it is important to put things into perspective. Despite the recent outflows, foreign investors poured in a whopping $24 billion into US stock ETFs in November 2024. The month of May also saw $5 billion in net purchases of US stocks.
So are foreign investors really pulling away from US stocks? If they are, US stocks are certainly not showing it with large-cap stocks in particular doing well.
The issue with US stocks comes from the difference in performance between megacap and small-cap stocks, as well as the growing discrepancy between the ‘mag 7’ and its weighting when it comes to the Nasdaq 100 and S&P 500.
The top 10 tech stocks reached a record market value of $20.5 trillion in June. Just 3 stocks, Nvidia (NASDAQ:NVDA), Microsoft (NASDAQ:MSFT), and Apple (NASDAQ:AAPL) reflect half of that total.
This also marks a $3 trillion market cap recovery since April’s low. Collectively, the top 10 have gained over $12 TRILLION in value over the last 3 years. Since 2012, these stocks' market cap has grown at an average annual rate of 23.4%.
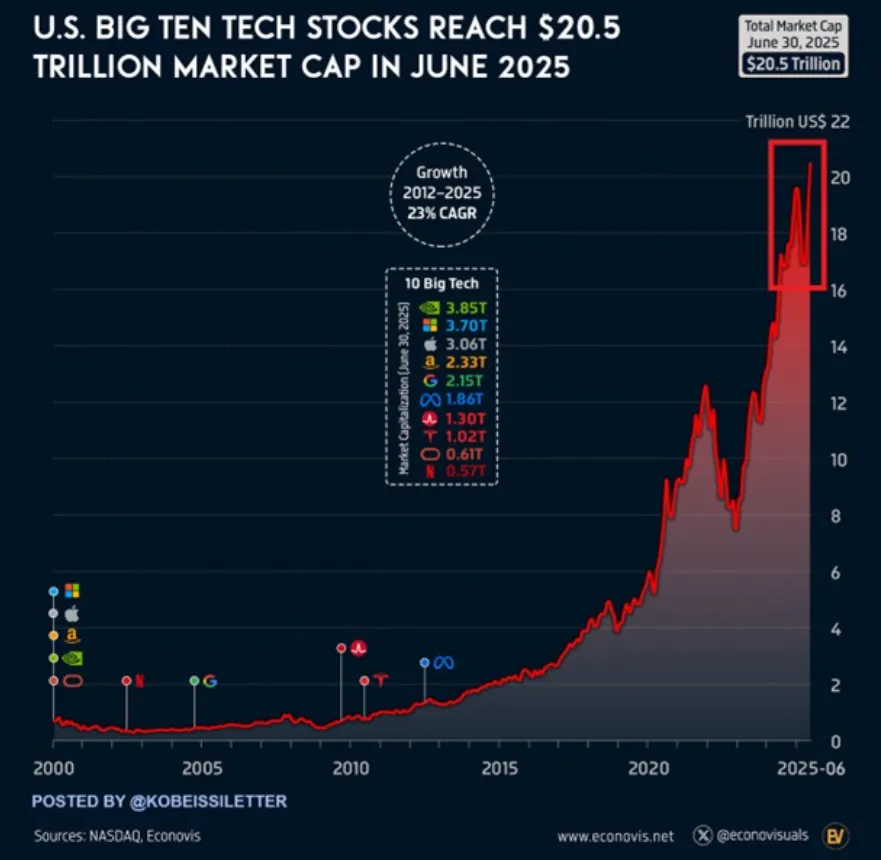
Source: Nasdaq, Kobeissi Letter
The best gauge of this for 2025 comes from a comparison in performance between the Russell 200 Index, S&P 500, and Nasdaq 100. The Russell 2000 index has gone 913 trading days without hitting an all-time high, the longest streak in 14 years.
This also marks the 3rd-longest stretch in history. The index is currently trading 10% below its November 2021 peak.
While the Nasdaq 100 and S&P 500 have reached multiple record highs in 2025, small caps continue to lag. Year-to-date, the Russell 2000 is flat, significantly underperforming the S&P 500 and Nasdaq, which are up 5.9% and 7.8%, respectively.
Meanwhile, 46% of companies in the index are currently unprofitable, near the highest share on record.
This has not fazed markets in recent years as Tech shares dominance continues to grow and this trend is thus far continuing.
Risks to Watch for in Q3
Tariffs remain a key component for Q3 2025, with President Trump's tariff pause coming to an end on July 9, 2025. There has been constant comments that trade deals are on the horizon, however, any setback and challenges could have repercussions to overall market sentiment and thus weigh on equities.
However, until a deal or no deal is actually announced, any such moves may prove to be short-lived as we have seen so far in 2025.
Earnings season is on the horizon once more and poor performances or significant downgrades to companies' outlooks could weigh on US equities. July is set to be a big one with 6 of the ‘Mag 7’ stocks reporting during the month, with Tesla (NASDAQ:TSLA) kicking things off on July 17.
Other Dates for the ‘Mag 7’ Stocks Earnings Releases:
Source: TradingView Earnings Calendar, Table Created by Zain Vawda
S&P 500 Technical Outlook
Looking at the S&P 500 from a technical lens, there is no historical price action to analyze as price hovers near all-time highs.
With that in mind, I thought it may be prudent to look at seasonality and other indicators that may provide some valuable insights.
The S&P posted a fresh all-time high last week which coincided with a golden cross pattern completion on June 27, as the 50-day MA crossed above the 200-day MA. Now, this is a bullish sign but there is some interesting data I came across which I thought is worth taking a look at.
Since 1950, the S&P 500's golden cross has been a reliable bullish signal, generating median returns of 13% over the following year, with positive returns about 80% of the time.
The chart below shows that three months after a golden cross pattern, the S&P 500 goes up 75.7% of the time, with an average return of about 4%. Over a 12-month period, the average return is around 11.2%.
Source: Carson Investment Research, Isabelnet
This does bode well for bulls but it is just data at the end of the day and no guarantee that this will occur once more. It is something to bear in mind and could prove useful when combined with technical and fundamental outlooks.
Key levels to keep an eye on:
Support
- 6067
- 6000
- 5851
Resistance
- 6282
- 6500
- 6750
Dow Jones Technical Outlook
The Dow Jones technical picture is slightly different with the index having tested its all-time highs from January, around the 45226 mark.
Similar to the S&P 500, there is no historical price action beyond this level to analyze. Thus I will be focused on psychological levels such as 45500, 46000 and 46500.
Looking at the downside though and there are some key levels to keep an eye on.
For now, bulls are firmly in control on the weekly chart below with a weekly candle close below the 42000 handle needed to invalidate the bullish momentum. Such a candle close leads to a change in structure and thus could lead to further downside.
Key support levels to keep an eye on rest at 42750, 42000 and the psychological 40000 handle.
Dow Jones Weekly Chart, July 4, 2025
Source: TradingView
Final Thoughts
The outlook for equities remains filled with optimism, at least that is what is being reflected in the price and recovery we have seen in Q2. Moving forward, further gains remain possible, especially if geopolitical risk subsides and the tariff saga finally reaches a conclusion.
Original Post
Trading in financial instruments and/or cryptocurrencies involves high risks including the risk of losing some, or all, of your investment amount, and may not be suitable for all investors. Prices of cryptocurrencies are extremely volatile and may be affected by external factors such as financial, regulatory or political events. Trading on margin increases the financial risks.
Before deciding to trade in financial instrument or cryptocurrencies you should be fully informed of the risks and costs associated with trading the financial markets, carefully consider your investment objectives, level of experience, and risk appetite, and seek professional advice where needed.
Fusion Media would like to remind you that the data contained in this website is not necessarily real-time nor accurate. The data and prices on the website are not necessarily provided by any market or exchange, but may be provided by market makers, and so prices may not be accurate and may differ from the actual price at any given market, meaning prices are indicative and not appropriate for trading purposes. Fusion Media and any provider of the data contained in this website will not accept liability for any loss or damage as a result of your trading, or your reliance on the information contained within this website.
It is prohibited to use, store, reproduce, display, modify, transmit or distribute the data contained in this website without the explicit prior written permission of Fusion Media and/or the data provider. All intellectual property rights are reserved by the providers and/or the exchange providing the data contained in this website.
Fusion Media may be compensated by the advertisers that appear on the website, based on your interaction with the advertisements or advertisers.