S&P 500 Could Break Out From Bullish Pattern Today - Where to Allocate Now
Fawad Razaqzada | Apr 11, 2024 06:15AM ET
- The S&P 500 chart displays signs of weakness, particularly as it broke below the 21-day exponential moving average, signaling a potential bearish trend.
- Traders are closely watching the SPY's behavior around key resistance levels, with the 21-day EMA acting as a critical barrier.
- Despite SPY's bearish signal, select sectors and individual stocks continue to exhibit bullish patterns, offering potential trade opportunities amid market uncertainty.
- 1. SPY breaks support at 21-day exponential average
- 2. XLE forms bull flag after bullish breakout
- 3. XOM hits new 2024 high: Where to next?
The big news this week was the release of another hotter-than-expected CPI report, causing investors to push back their rate cut expectations.
The market now thinks that the Federal Reserve will cut rates just twice this year starting in September, which is a major turn of events that looked unlikely at the start of the year.
But while there is a risk that the major indexes may decline as a result of the continued rise in bond yields, owing to concerns about inflation and interest rates remaining elevated for longer than expected, there are certain sectors or stocks that could still hold their well.
The current market environment is one where investors have to be selective about which stocks they want to invest in.
In this regard, our predictive AI stock-picking tool can prove a game-changer. For less than $9 a month , it will update you on a monthly basis with a timely selection of AI-picked buys and sells, giving you a significant edge over the market.
Subscribe now and position your portfolio one step ahead of everyone else !
Among the sectors and individual stocks that could do well in this scenario are XLE (NYSE:XLE) and Exxon Mobil Corp (NYSE:XOM).
What to expect for the rest of this week?
The market's response was a swift one on Wednesday, although we didn't see much further downside follow-through after the immediate negative reaction to the CPI data, suggesting that bearish traders are too afraid to stand in the way of the stock markets given how strong the rally had been in the last couple of quarters, with investors ignoring all sorts of bearish catalysts.
Additionally, we have bank earnings starting this week, which is another factor discouraging the bears from entering the fray too forcefully, while the crude oil rally – thanks to heightened geopolitical risks in the Middle East concerning Iran and Israel – helped to support share prices of energy companies.
Looking ahead, traders will be watching the US PPI data, following the hotter-than-expected CPI report the day before. If evidence of sticky inflation is also evident in PPI data, this could further weigh on risk sentiment.
Stocks set for deeper correction?
The somewhat sluggish start to Q2 comes after stocks had been on a blinder for the last 5 months, thanks in part to AI hype and prior optimism about potential interest rate cuts by the Federal Reserve, and other major central banks, starting by June or even earlier.
Since late October, the S&P 500 has shot up about 28%, so there was always the potential for some profit-taking which we got in these last couple of weeks. Now, there is renewed uncertainty over interest rates and the market’s pricing of the probability of a June cut has fallen sharply.
Despite the Fed’s sharp tightening of its belt, inflation is showing signs of re-accelerating and economic data has remained quite resilient. So, the key question is whether further weakness may be on the way. As traders, we must be prepared for both scenarios, and keep a close eye on key levels of indexes, and sectors individually.
Following the big rally over the past 5 months or so, the risks of a correction remain high, especially when you consider for example that US oil prices are north of $85 per barrel and governments are facing rising costs of servicing their debt as yields climb, making it increasingly difficult to continue borrowing without raising the debt-to-GDP ratios to alarming levels.
So far in 2024, investors have largely shrugged off these worries and concerns about over-stretched valuations. Let’s see if that changes as we head deeper into Q2 and 2024.
3 Trade ideas on SPY, XLE, and XOM
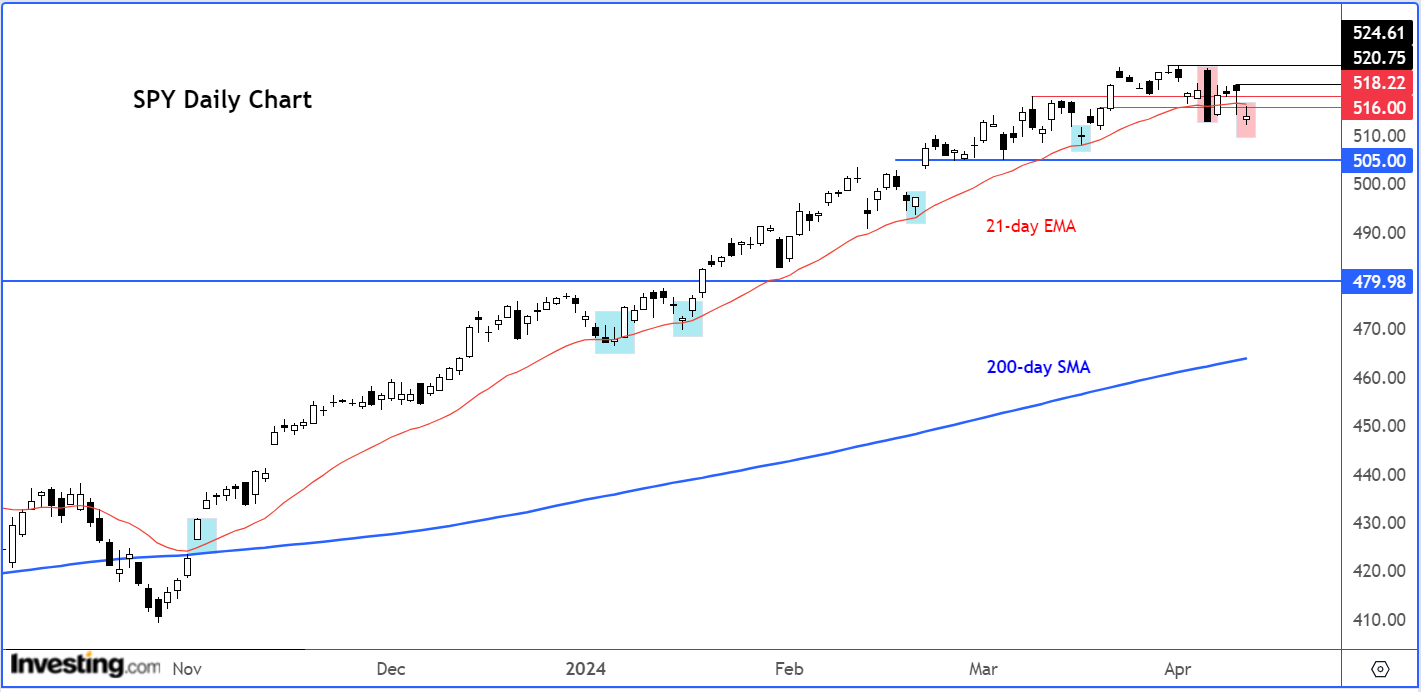
The chart of SPY, which tracks the S&P 500, is starting to look a little bit weak. On Wednesday, it gapped and closed below the 21-day exponential moving average, adding to the recent bearish signals.
Last Thursday for example we saw a big bearish reversal candle form on the daily timeframe, albeit we didn't see any immediate downside follow-through. Nevertheless, it is a bear signal that has not yet been invalidated by bullish price action as we haven't crossed above that candlestick’s high.
The importance of the 21-day exponential moving average should not be underestimated as you can see on the chart, this moving average came to the rescue to provide a floor on multiple occasions in the last several months. Since January, the market has found significant support on at least 5 or 6 occasions around this MA. Since breaking above it in early November, the SPY has held back above this MA during the entire phase of the rally.
Thus, what the bulls need to see is for the MA to be recaptured as quickly as possible and for the index to form an interim higher high to break the recent trend of bearish price action. A move above this week's high at 5210.75 would provide a bullish signal, as that would completely invalidate Wednesday’s bearish signals.
The bears, meanwhile, have now had a few bearish signals to work with, although they will need to show a lot more effort to change the trend completely in their favor. This 21-day eMA happens to come in right between the key short-term resistance range in the 516.00 to 518.22 area, which was formerly support and resistance.
For as long as this area holds as resistance moving forward, the bears will feel they have the upper hand insofar as the short-term trend is concerned. Now that we are below this area and the 21-day, this has increased the likelihood we could see the SPY potentially drop to the next support around 505.00 area.
The SPDR S&P 500 ETF Trust is an exchange-traded fund traded with the symbol SPY. Its purpose is to mirror the performance of the S&P 500 stock market index. This ETF holds the distinction of being the largest and oldest ETF in the United States.
The SPDR Select Sector Fund, or simply XLE, an ETF that tracks energy prices, broke out a couple of weeks ago above the highs of 2022 and 2023 in the area between 93.69 to 94.71. On Wednesday, while the stock markets fell, this ETF formed a bullish candle and remained inside what looks like a small bullish flag pattern.
Therefore, we still don't have any bearish signals on the XLE which remains poised to potentially rise towards 100.00 and possibly even the 2014 high at 101.52. Key support comes in at around that breakout area of 93.69 to 94.71.
Among the individual energy stocks to watch in the energy sector is ExxonMobil (NYSE:XOM) chart.
XOM broke out above the previous resistance in the 119.63 to 120.70 range at the back end of last week. On Wednesday, recovered from earlier weakness to close at a new 2024 high, holding above the breakout area. More gains look like, with crude oil extending its gains.
Be sure to check out InvestingPro to stay in sync with the market trend and what it means for your trading. As with any investment, it's crucial to research extensively before making any decisions.
InvestingPro empowers investors to make informed decisions by providing a comprehensive analysis of undervalued stocks with the potential for significant upside in the market.
Subscribe here for under $9/month and never miss a bull market again !
Don't forget your free gift! Use coupon codes OAPRO2 at checkout to claim an extra 10% off on the Pro yearly and bi-yearly plans.
Disclaimer: This article is written for informational purposes only; it does not constitute a solicitation, offer, advice, or recommendation to invest as such it is not intended to incentivize the purchase of assets in any way. I would like to remind you that any type of asset, is evaluated from multiple points of view and is highly risky and therefore, any investment decision and the associated risk remains with the investor.
Read my articles at City Index
Trading in financial instruments and/or cryptocurrencies involves high risks including the risk of losing some, or all, of your investment amount, and may not be suitable for all investors. Prices of cryptocurrencies are extremely volatile and may be affected by external factors such as financial, regulatory or political events. Trading on margin increases the financial risks.
Before deciding to trade in financial instrument or cryptocurrencies you should be fully informed of the risks and costs associated with trading the financial markets, carefully consider your investment objectives, level of experience, and risk appetite, and seek professional advice where needed.
Fusion Media would like to remind you that the data contained in this website is not necessarily real-time nor accurate. The data and prices on the website are not necessarily provided by any market or exchange, but may be provided by market makers, and so prices may not be accurate and may differ from the actual price at any given market, meaning prices are indicative and not appropriate for trading purposes. Fusion Media and any provider of the data contained in this website will not accept liability for any loss or damage as a result of your trading, or your reliance on the information contained within this website.
It is prohibited to use, store, reproduce, display, modify, transmit or distribute the data contained in this website without the explicit prior written permission of Fusion Media and/or the data provider. All intellectual property rights are reserved by the providers and/or the exchange providing the data contained in this website.
Fusion Media may be compensated by the advertisers that appear on the website, based on your interaction with the advertisements or advertisers.