S&P 500 Bulls Eye Breakout Above a Strong Resistance Zone
Craig Thompson | May 06, 2024 02:48AM ET
In last month’s newsletter, I wrote the following:
“In the short term, the stock market is overbought, momentum is waning, and volume indicators are falling. This is a warning (not a signal) that the market is ripe for a short-term pullback.”
“Most investors believe the Fed will lower interest rates three times this year. Bond yields, commodities, and relative sector performance suggest that may not be as likely as most people believe.”
Heading into April, the prevailing view was that the Fed would lower interest rates three times before year’s end. Typically, a strong economy and lower interest rates support a bullish stock market. However, April’s inflation data came in higher than expected, causing interest rates to rise and prompting investors to adjust their expectations. Consequently, the S&P 500 dropped by a little over 4%.
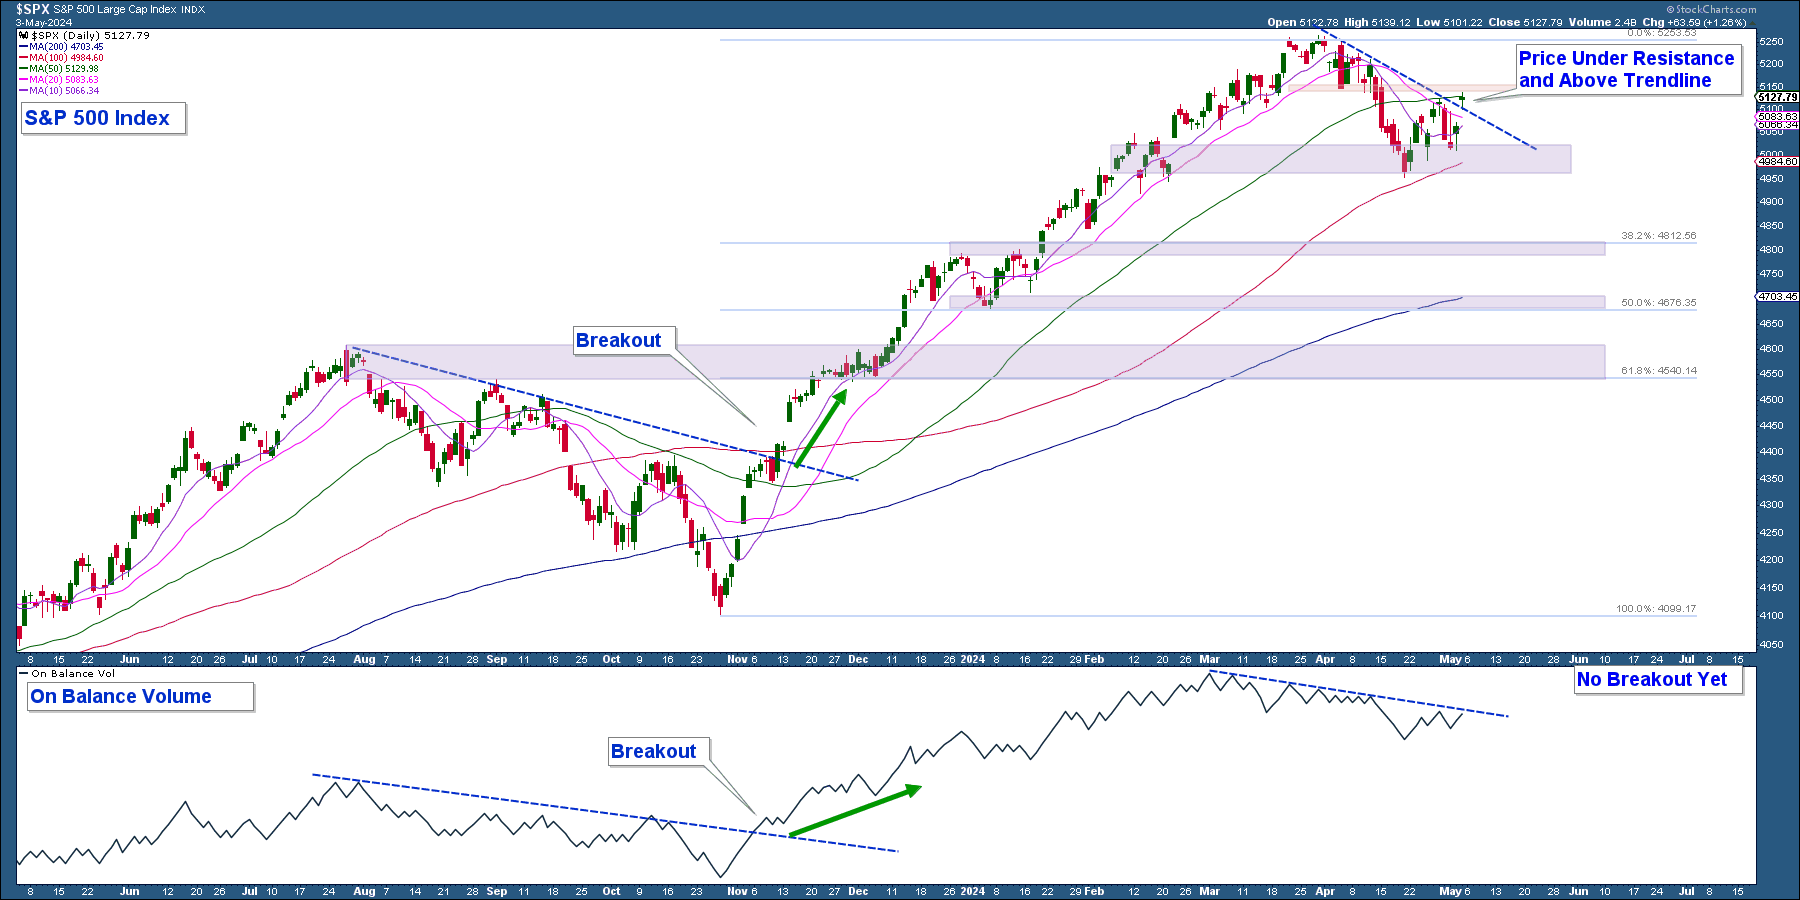
The stock market is now experiencing a short-term pullback and our job is to analyze the data to determine when the market recovers. Below is a chart of the S&P 500 in the top panel and On Balance Volume (OBV), a volume indicator, in the lower panel. Here are my takeaways:
- The red horizontal line marks an area of resistance, while the purple lines highlight areas of support based on previous highs and lows, and Fibonacci retracement levels.
- The index surged after a three-month correction starting in early November, which led to the index becoming overextended.
- In April, the index pulled back, falling below its 10, 20, and 50-day simple moving averages.
- The index advanced slightly above its short-term downtrend line and is sitting under an area of resistance.
- For comparison purposes, look at last year’s correction. The signal that the correction had concluded was when the index and OBV moved decisively above their respective downtrend lines.
Conclusion: The market is at a short-term inflection point. A strong move above resistance combined with a break higher in OBV would signal the market pullback has run its course. Conversely, if the index declines from here, it would suggest continued market weakness.
Bond Yields
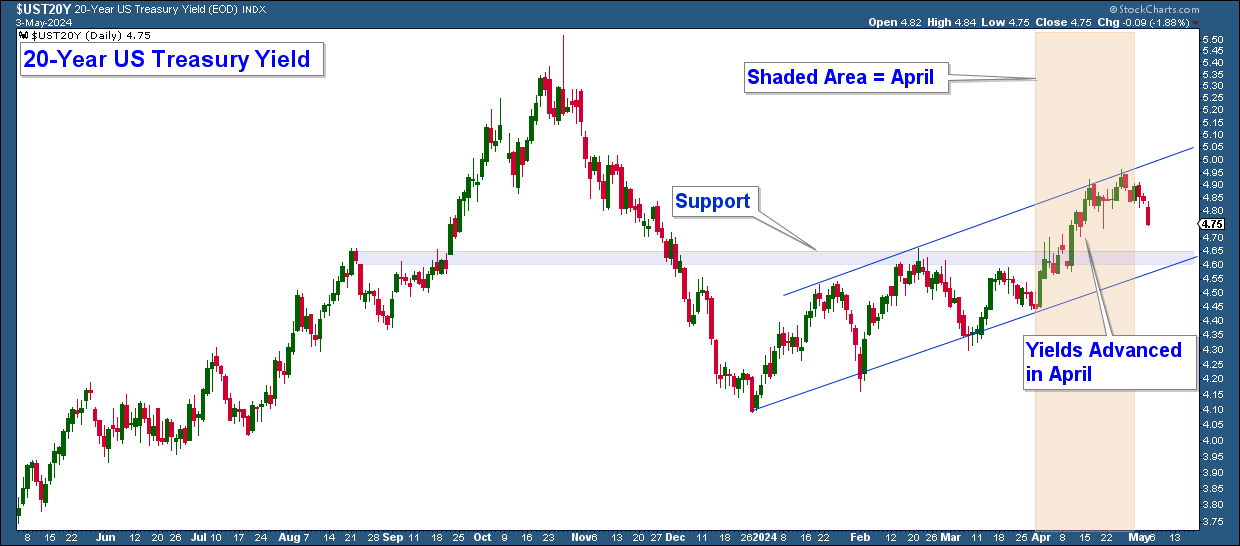
Bond yields fell sharply at the end of last year but reversed direction in 2024, with yields climbing steadily since then. Rising yields are putting pressure on stocks. Below is a chart of the 20-Year US Treasury Yield. Here are my observations:
- Yields are rising within an uptrending channel.
- The sharp rise in April, shown in the shaded price data, coincided with a stock market drop
- The purple line represents a significant support level.
Conclusion: Rates continuing to rise will be a headwind for stocks. Conversely, if rates fall below support and the lower end of the channel it would be bullish for stocks unless driven by a crisis-driven flight to safety.
Risk-On
During favorable market conditions, there is typically a tendency for more aggressive sectors and industry groups to outperform. These sectors often include technology, consumer discretionary, and small-cap stocks, which tend to benefit from economic growth and investor optimism. When these sectors perform well, it often signals increasing confidence in the broader stock market.
The chart below displays the S&P 500 Index in the top panel and four relative strength charts underneath. These charts compare four risk-on groups against either a risk-off sector or the S&P 500. An increase in the line signifies the risk-on sector is outperforming. Here are my takeaways:
- The green trendline underscores Semiconductors’ outperformance. However, it fell below its trendline, signaling Consumer Staples (NYSE:XLP) outperformed Semiconductors (NASDAQ:SOXX) in April (red square).
- Small Cap, Nasdaq 100, and Software stocks have been underperforming for months, but they are all nearing their respective downtrend lines.
Conclusion: A strong move higher in these risk-on groups would add confidence to a move higher in major market indexes.
Risk-Off
In uncertain market conditions, more defensive sectors such as Utilities and Consumer Staples tend to perform better as investors seek stability and lower risk. These sectors are generally seen as safer investments because they offer consistent dividends and steady earnings. Strong performance in these sectors often signals a cautious or risk-averse sentiment in the broader stock market.
The chart below displays the S&P 500 Index in the top panel and relative strength charts underneath, comparing Utilities and Staples to the S&P 500. An increase in the lines indicates these risk-off sectors are outperforming the S&P 500. Here are my takeaways:
- Utilities and Staples were underperforming the S&P 500 for over a year. However, in April, they both moved above their respective downtrend lines, indicating they are now outperforming.
- The recent performance of these sectors suggests a shift in market sentiment towards a more cautious approach.
Conclusion: Continued outperformance in Utilities and Staples would suggest a more risk-off stance among investors, which could signal caution in the broader stock market.
Summary
The S&P 500 is positioned below a key resistance level and slightly above its short-term downtrend line. A decisive move higher would be bullish for the broader stock market, especially if it is accompanied by falling yields and an upturn in risk-on asset performance.
Monitoring these developments will be crucial for assessing the market’s direction and managing risk effectively.
Client Account Update
At the beginning of last month, client accounts were nearly fully invested, with a mix of long and short positions. The short positions were added to balance risk and reduce net equity exposure, as the market appeared extended.
I also tightened stop-loss levels on our holdings, which led to some positions being sold as a result of market fluctuations.
Last week, I exited all short positions except for our Treasury Bond short funds.
Currently, our net equity allocation is conservative, well below full investment.
If market conditions improve, I will increase equity allocation, while further deterioration may lead to a decrease in equity exposure.
Trading in financial instruments and/or cryptocurrencies involves high risks including the risk of losing some, or all, of your investment amount, and may not be suitable for all investors. Prices of cryptocurrencies are extremely volatile and may be affected by external factors such as financial, regulatory or political events. Trading on margin increases the financial risks.
Before deciding to trade in financial instrument or cryptocurrencies you should be fully informed of the risks and costs associated with trading the financial markets, carefully consider your investment objectives, level of experience, and risk appetite, and seek professional advice where needed.
Fusion Media would like to remind you that the data contained in this website is not necessarily real-time nor accurate. The data and prices on the website are not necessarily provided by any market or exchange, but may be provided by market makers, and so prices may not be accurate and may differ from the actual price at any given market, meaning prices are indicative and not appropriate for trading purposes. Fusion Media and any provider of the data contained in this website will not accept liability for any loss or damage as a result of your trading, or your reliance on the information contained within this website.
It is prohibited to use, store, reproduce, display, modify, transmit or distribute the data contained in this website without the explicit prior written permission of Fusion Media and/or the data provider. All intellectual property rights are reserved by the providers and/or the exchange providing the data contained in this website.
Fusion Media may be compensated by the advertisers that appear on the website, based on your interaction with the advertisements or advertisers.